> ## Documentation Index
> Fetch the complete documentation index at: https://docs.flashduty.com/llms.txt
> Use this file to discover all available pages before exploring further.
# Flashduty Monitors Getting Started
> Monitors quick start guide to help you get started with alerting
To experience Monitors features, there are three core steps:
Deploy the alert engine to your private network
Configure the data sources to monitor
Define alert conditions and notification methods
## Install monitedge
`monitedge` needs to be deployed in your private network. It is responsible for syncing alert rules from SaaS, periodically querying data sources, performing threshold evaluation, generating alert events, and pushing them to the SaaS.
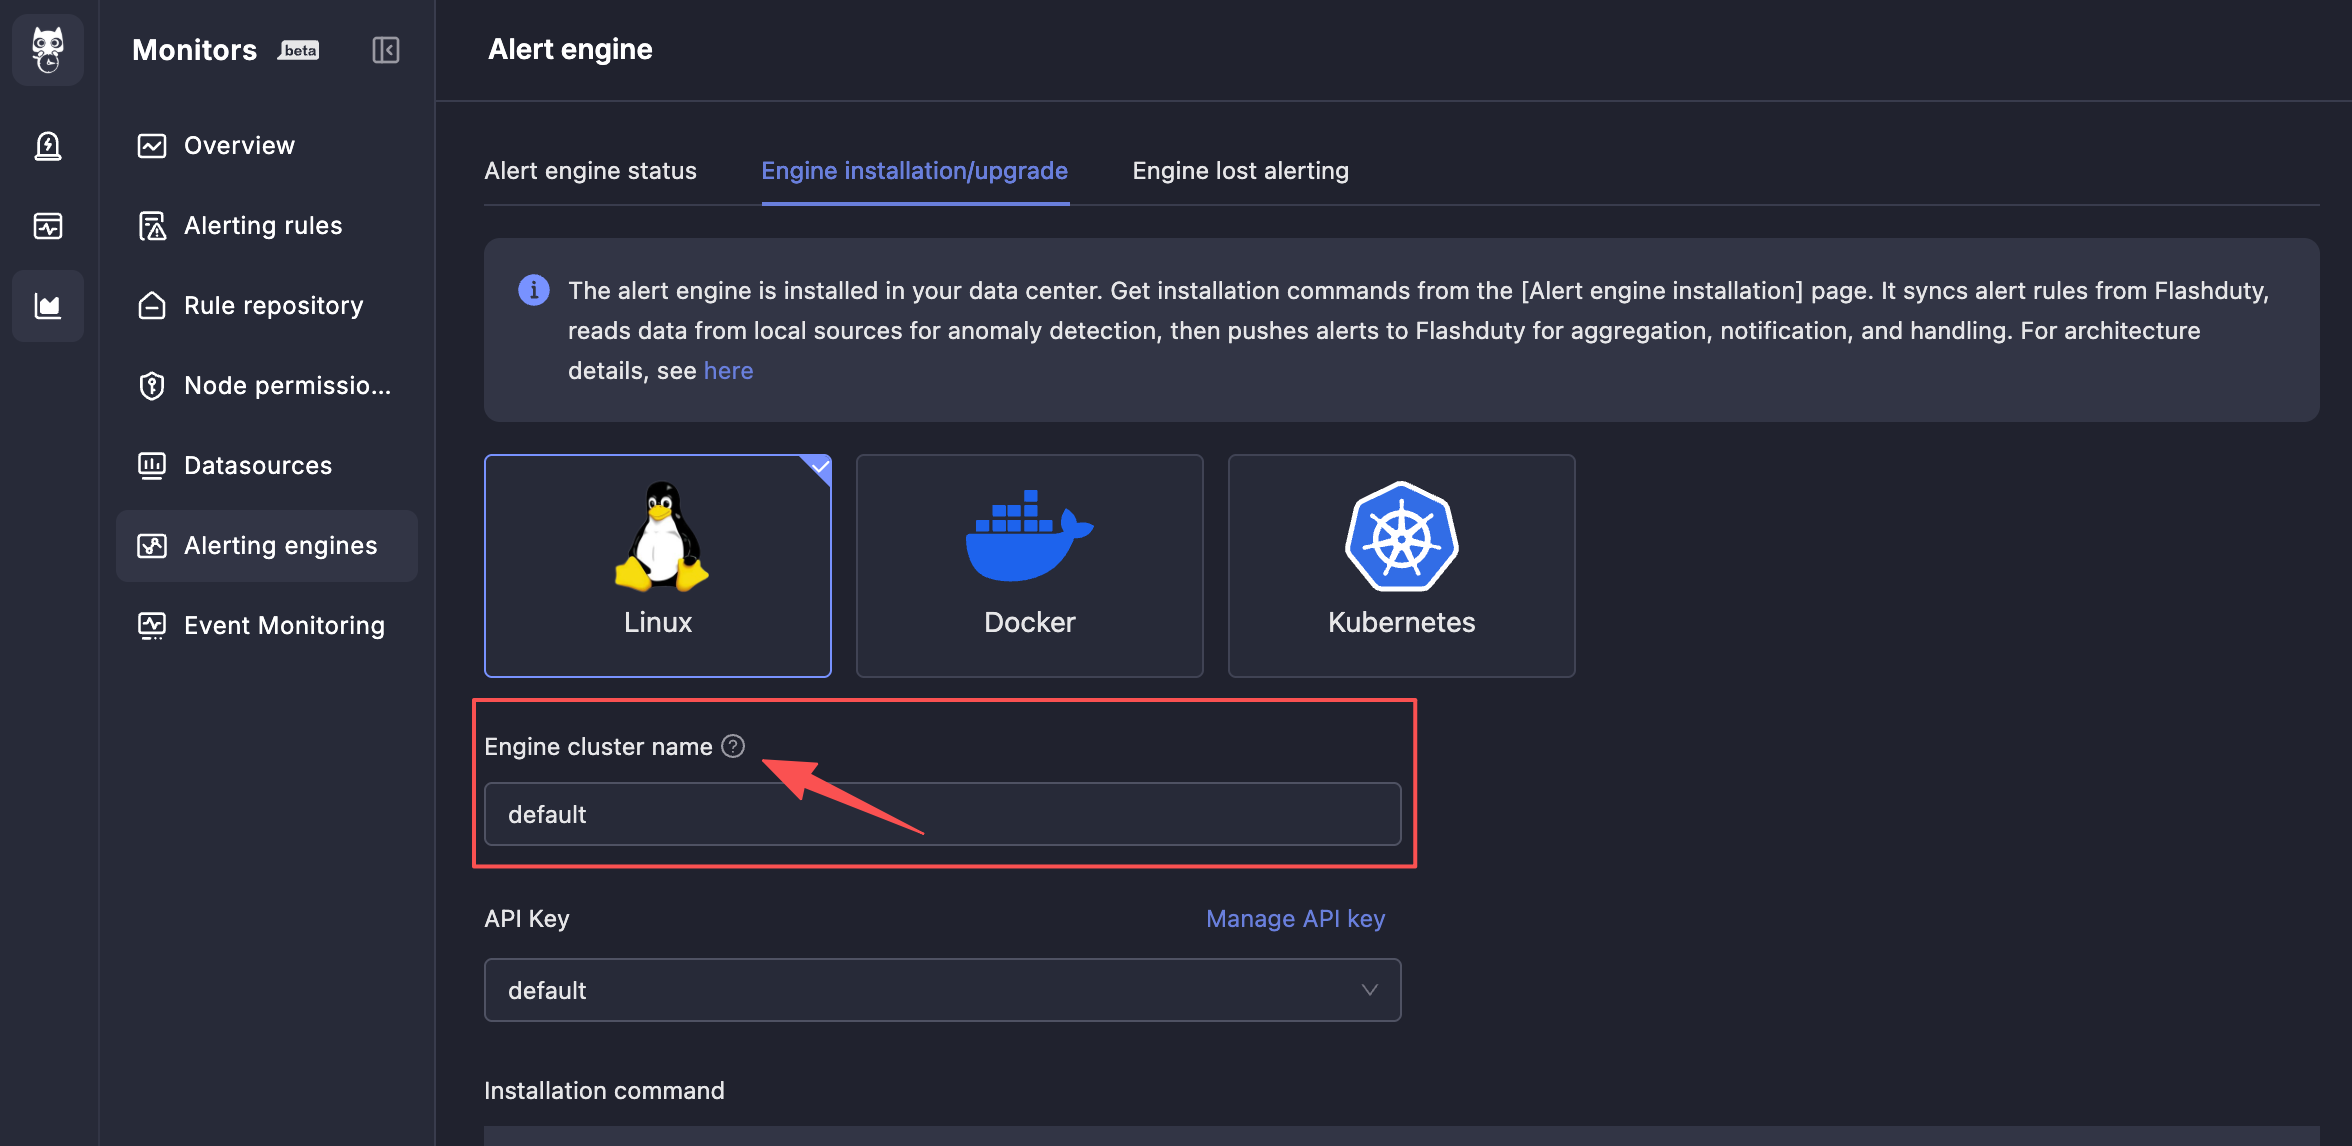
**Menu Entry**: Alert Engine → Engine Installation/Upgrade
Supports Linux, Docker, and Kubernetes installation methods.
**Engine Cluster Name** is very important: `monitedge` instances with the same name form a cluster, sharing the workload of processing alert rules to avoid single points of failure.
* Single cluster: Keep the default `default`
* Multiple clusters (e.g., one in US-East datacenter, one in South China datacenter): Specify different names for each cluster
### Alert Engine Status
After `monitedge` is installed, it automatically connects to the SaaS and periodically syncs alert rules. You can view current status information on the Alert Engine Status page.
Engine instances without heartbeat for a long time will display a delete button, which you can click to remove and avoid engine disconnection alerts.
### Engine Disconnection Alert
`monitedge` downtime has significant impact, so engine disconnection alerts are provided.
For an engine cluster composed of multiple instances, as long as at least one instance in the cluster is alive, the engine disconnection alert will not trigger.
## Create Data Source
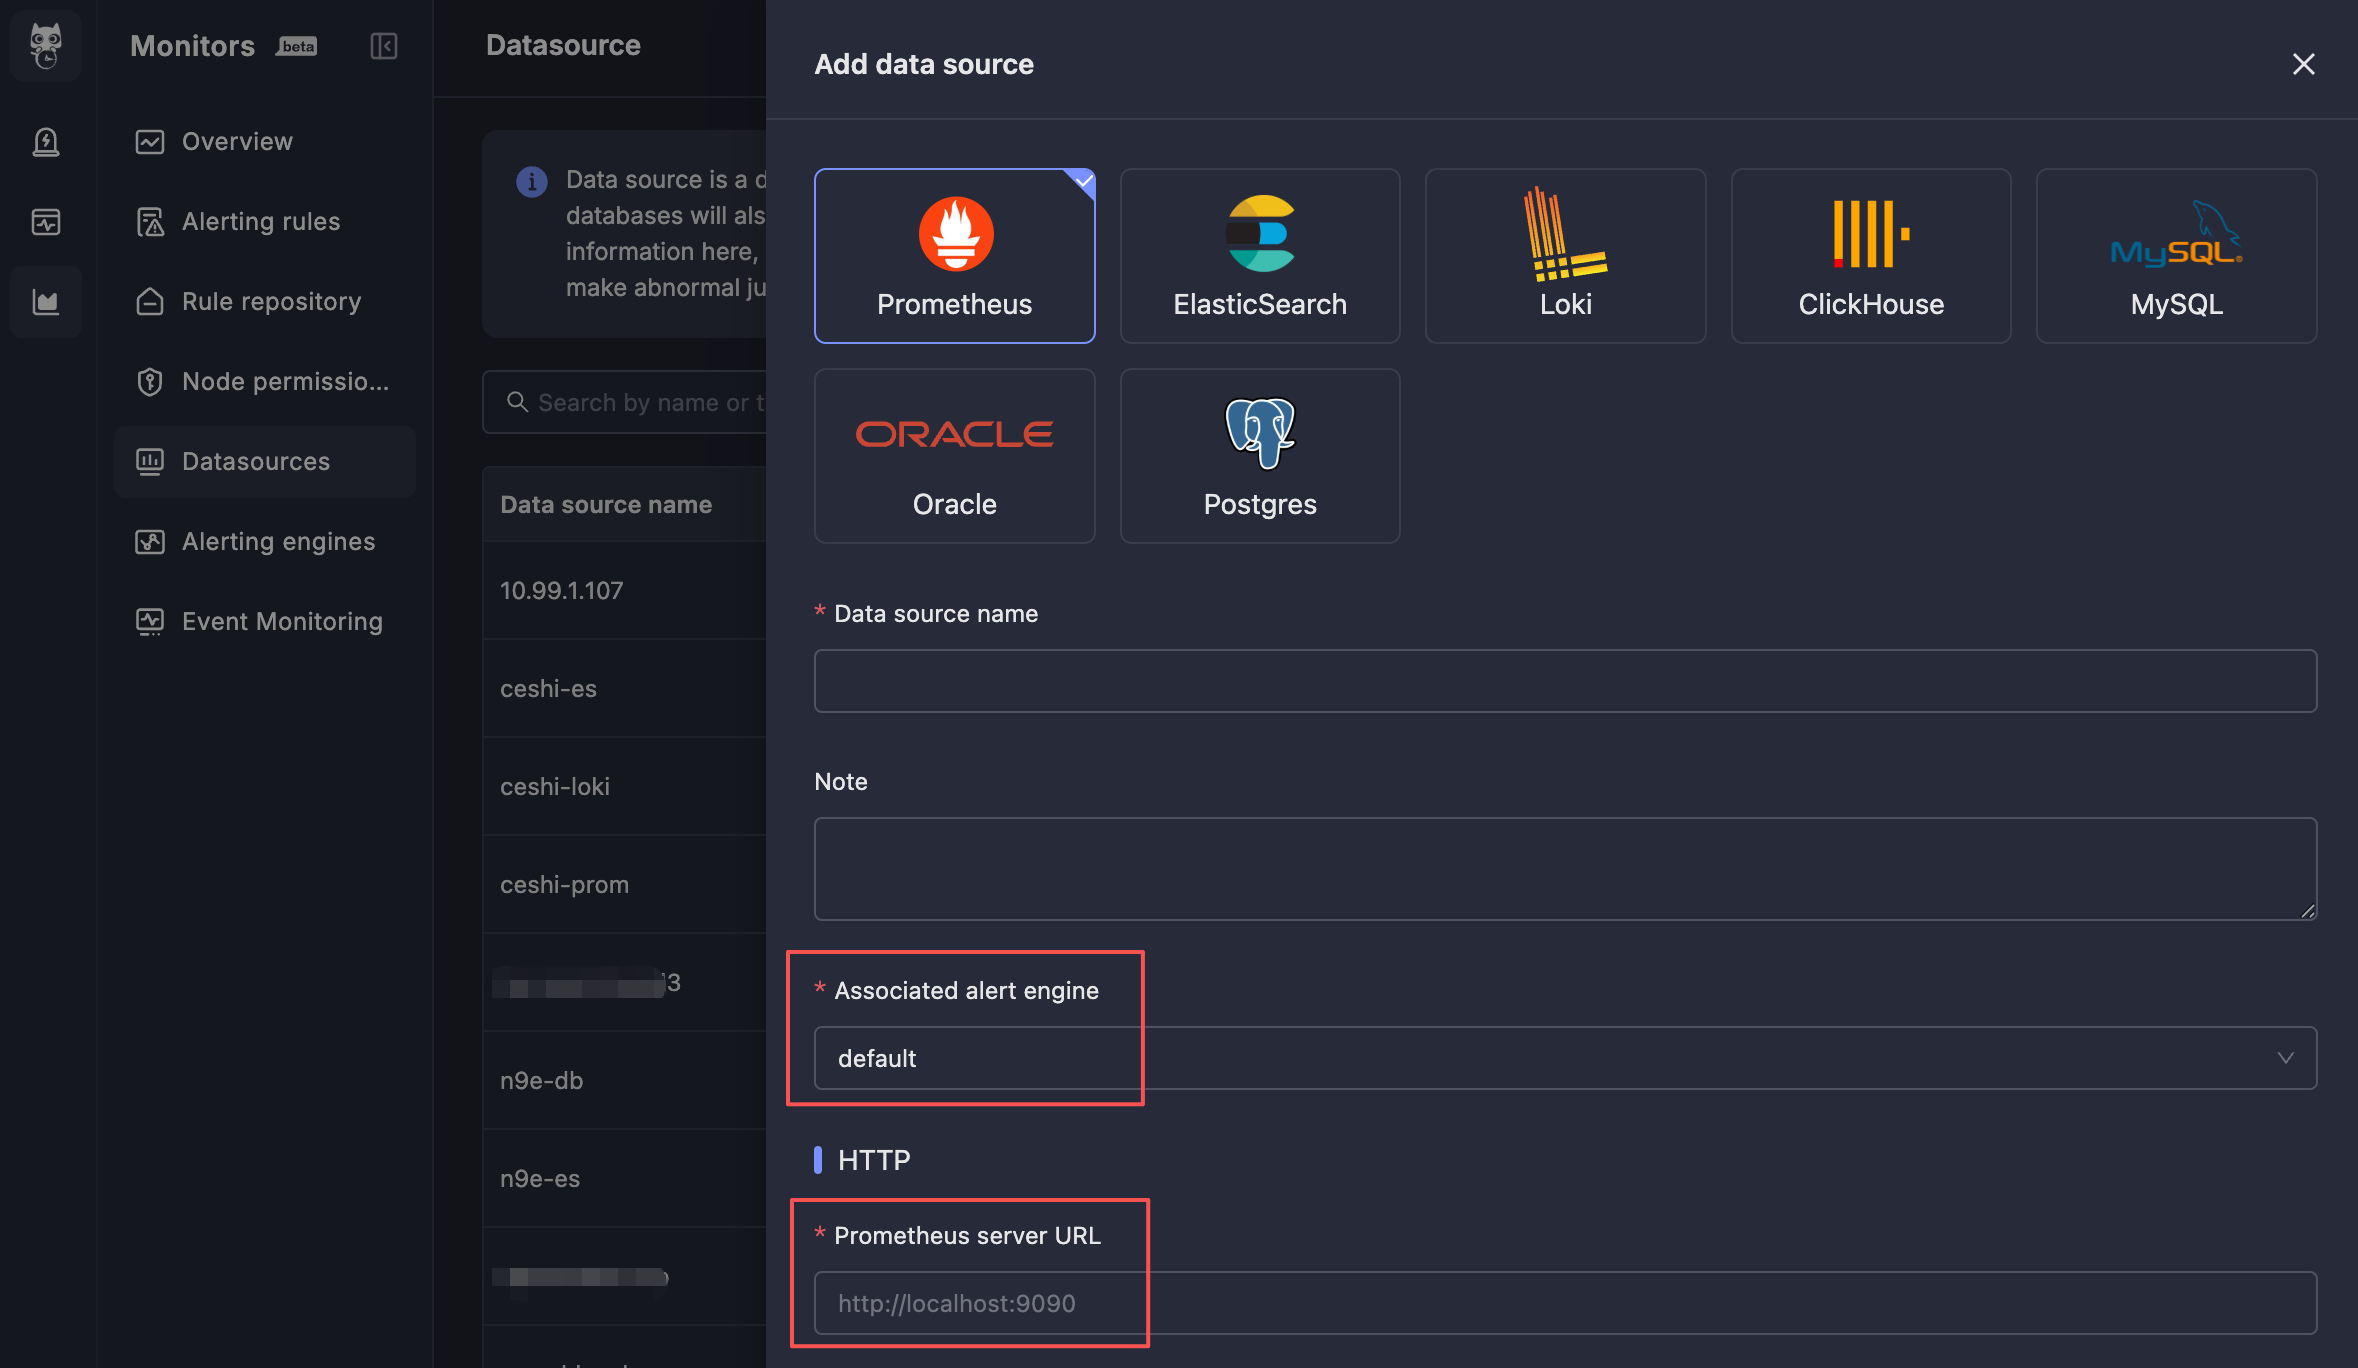
**Menu Entry**: Data Sources → New
| Config Item | Description |
| ------------------------------ | ----------------------------------------------------------------------------------------------------------------------------------------------------- |
| **Associated Alert Engine** | Specify which alert engine cluster performs data queries and alert evaluation for this data source; typically select a cluster in the same datacenter |
| **Data Source Connection URL** | The address for `monitedge` to connect to; must be an internal address accessible by `monitedge` |
## Create Alert Rules
**Menu Entry**: Alert Rules
There may be many alert rules. Monitors provides a tree-structured grouping for categorized management. Each alert rule must belong to a group. You can create groups first, then create alert rules under the groups.
### Basic Configuration
| Config Item | Description |
| --------------------- | ------------------------------------------------------------------------------------------------------------------------------------------------------------------------------------------------------------------------------------------ |
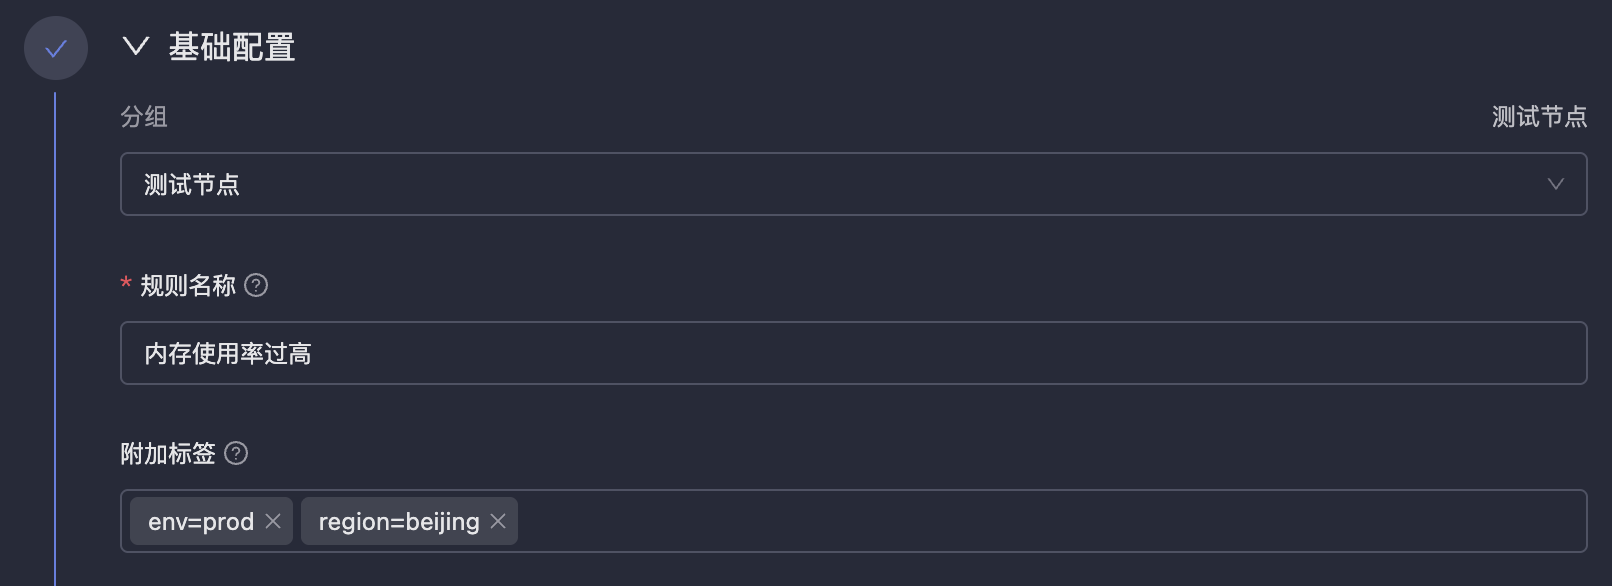
| **Rule Name** | Name of the alert rule; does not support variable references (fixed names facilitate filtering and grouping operations). It must be unique within its group; imports, edits, and moves fail if the target group already contains that name |
| **Additional Labels** | Similar to `labels` in Prometheus; attached to all alert events for filtering, routing, and inhibition |
### Data Source Selection
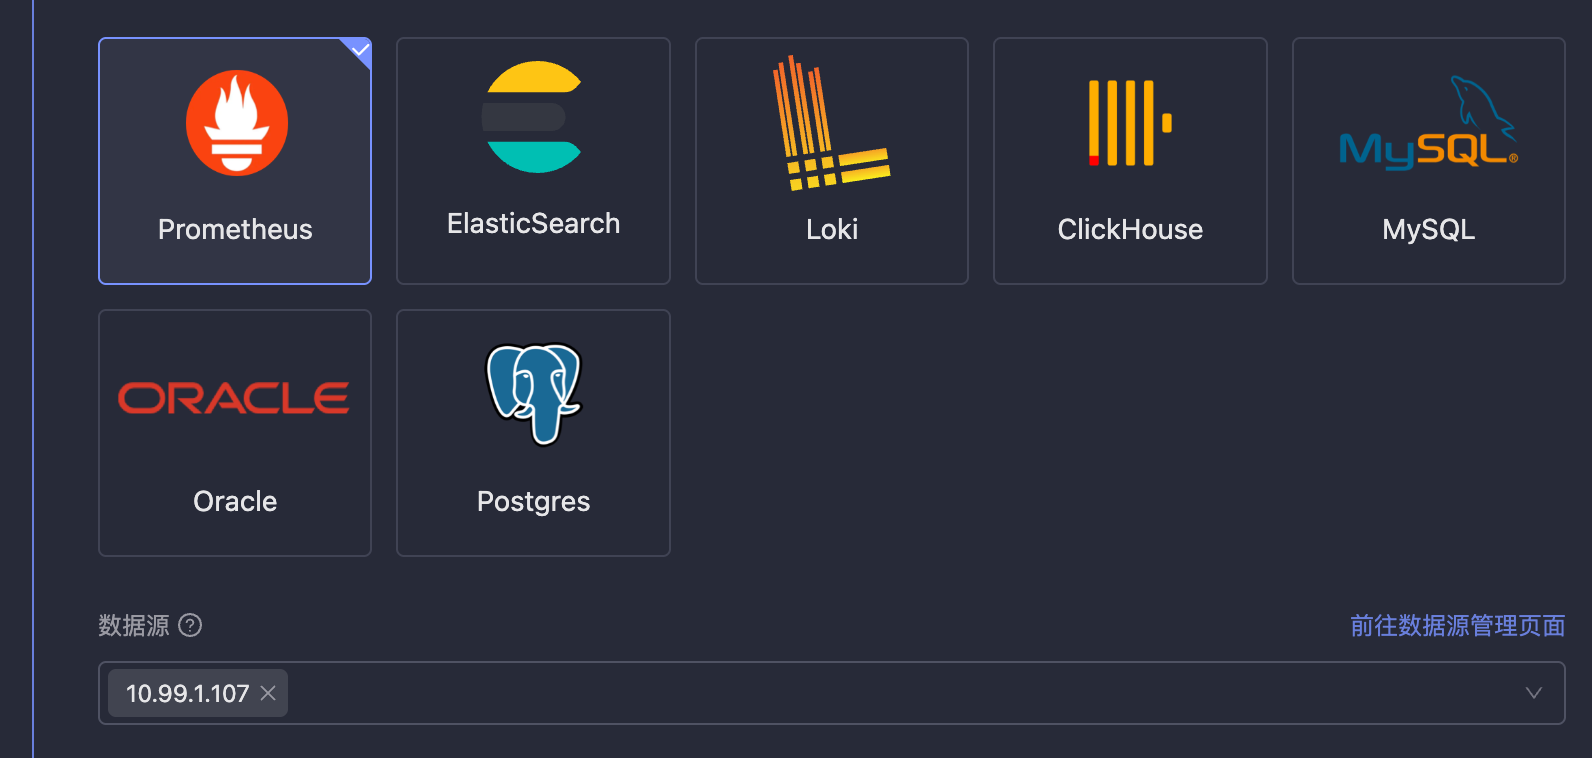
Monitors supports a single rule applying to multiple data sources with two binding methods:
* **Wildcard by name**: Match data sources by name using wildcards. `*` matches all data sources; `db-*` matches all data sources starting with `db-`. Stores name strings, so renaming a data source affects matching.
* **Exact match by ID**: Select specific data sources from a dropdown by ID. Unaffected by data source renames.
Both methods can be used together, and at least one must be specified. The rule applies to all data sources matched by either method.
If you need stable rule bindings that are unaffected by data source renames, prefer exact match. See [Data Source Management](/en/monitors/data-sources/data-sources) for details.
### Query Detection Method
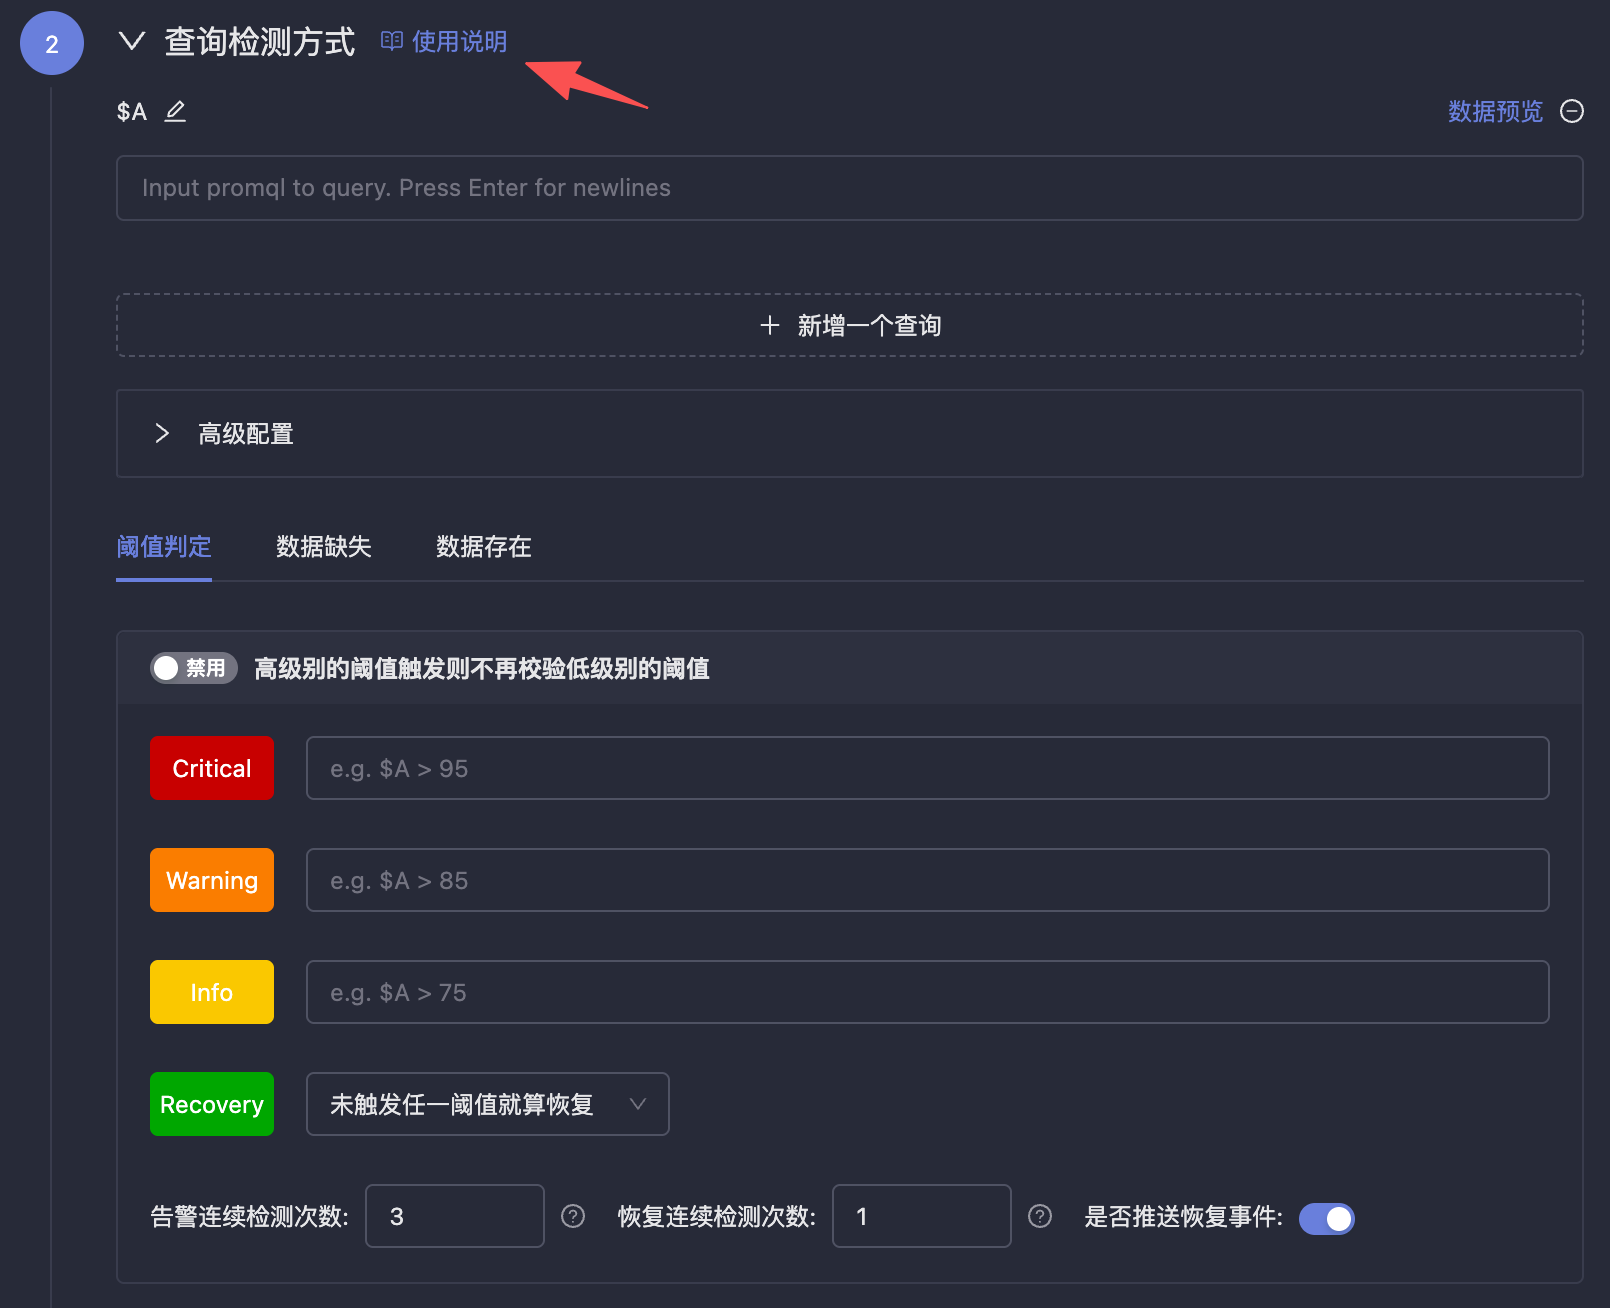
Configure how to query data sources and how to evaluate alert conditions. Please read the usage instructions on the right side of **Query Detection Method** on the page.
| Config Item | Description |
| ---------------- | ----------------------------------------------------------------------------------------------------------------------------------------------------------------------------------------------------------- |
| **Query Offset** | Sets the query time offset (in seconds) to handle data source ingestion lag. For example, setting it to 60 shifts the query window back by 60 seconds, ensuring data has been fully written before querying |
### Detection Frequency and Effective Time
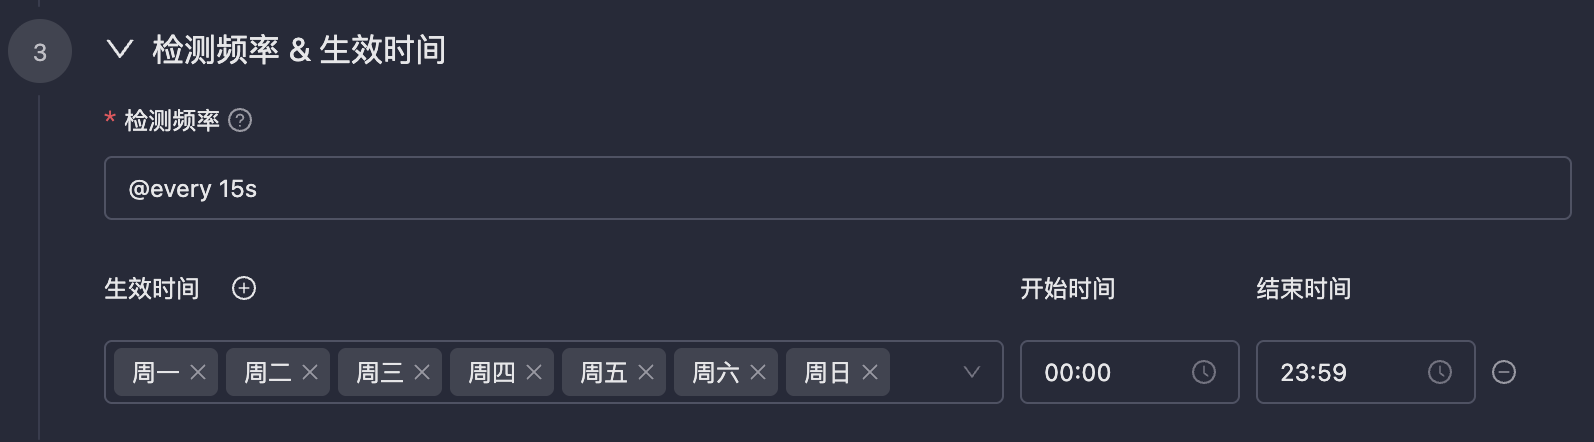
| Config Item | Description |
| ----------------------- | ---------------------------------------------------------------------------------------------------------------------------------------------------------------------------------------------------------------------------------------------------------------- |
| **Detection Frequency** | Usually periodic detection; also supports `cron` expressions (down to seconds) |
| **Rule Timezone** | The timezone in which the rule executes. It controls how `cron` schedules and **Effective Time** windows are interpreted. Defaults to `Asia/Shanghai`. Must be a valid IANA timezone name such as `Asia/Shanghai`, `UTC`, `Europe/London`, or `America/New_York` |
| **Effective Time** | Time period when the alert rule is effective; alerts will not trigger outside this period. Time windows are evaluated in the **Rule Timezone** above |
**Timezone rules**:
* **Rule Timezone** only accepts IANA timezone names. Shortcuts and offsets such as `Local`, `UTC+8`, `CST`, or `GMT+8` are rejected.
* **`cron` expressions must not start with `CRON_TZ=` or `TZ=`**. If you are migrating from an open-source cron system that embeds the timezone in the cron string (for example, `CRON_TZ=Asia/Shanghai 0 0 * * *`), remove the prefix and set the timezone in **Rule Timezone** instead.
### Event Configuration
| Config Item | Description |
| ----------------------- | ----------------------------------------------------------------------------------------------------------------- |
| **Custom Fields** | Similar to `annotations` in Prometheus; can attach dashboard URLs, SOP URLs, etc. |
| **Related Query** | Not used for threshold evaluation, but can be included in notes as variable references (e.g., attach log samples) |
| **Notes Description** | Unstructured text field; supports variable references to help responders quickly locate issues |
| **Channel** | Specify a channel in Flashduty On-call; if not specified, delivery follows integration routing rules |
| **Repeat Notification** | Continues notifying when alert is not recovered; configurable interval and maximum count (default 10000) |
The maximum notification count does not represent the number of message reminders end users receive. Because alert events generated by Monitors are delivered to On-call, they may be grouped and noise-reduced; the final send count depends on On-call configuration.
## View Results
After configuration is complete, if alert conditions trigger, the status before the alert rule will change to `Triggered`.
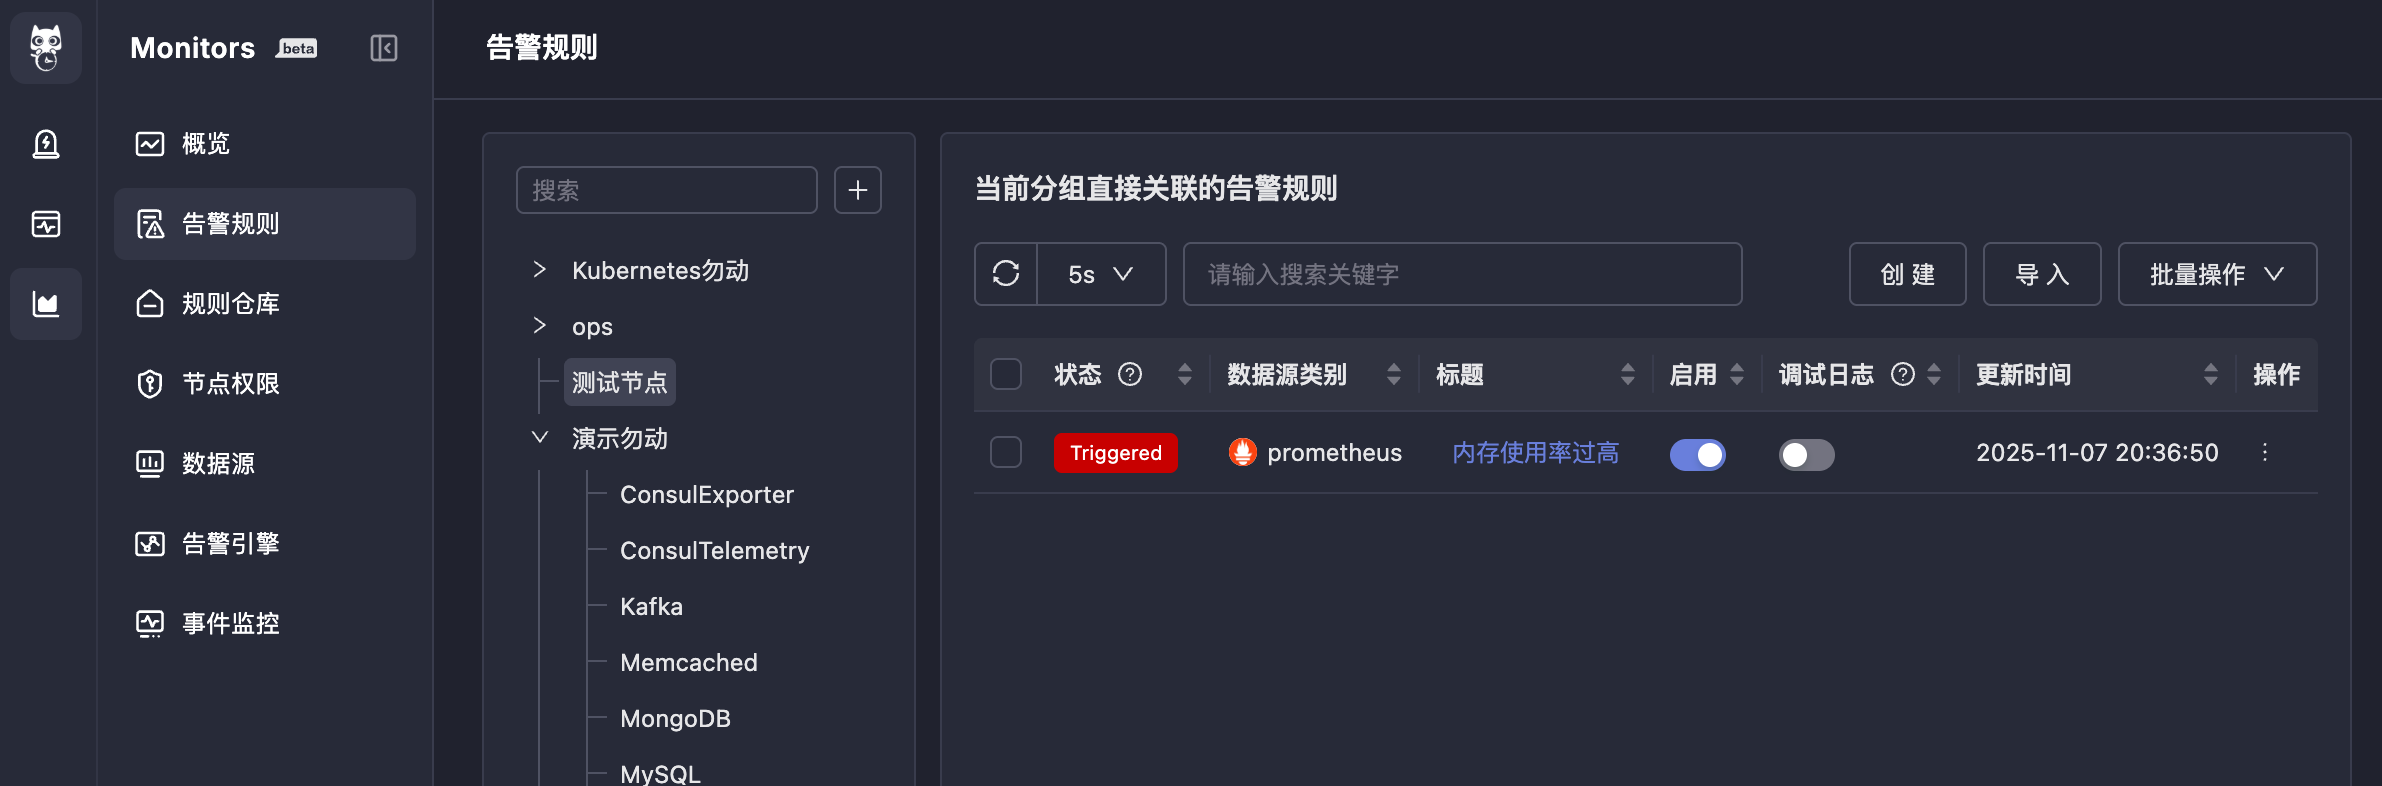
The search box in the alert rules list supports filtering by rule name, rule ID, or labels for quick navigation. You can also use the URL parameter `?rule_id=` to jump directly to a specific rule.
Click `Triggered` to see the alert events generated by this rule (also viewable in On-call):
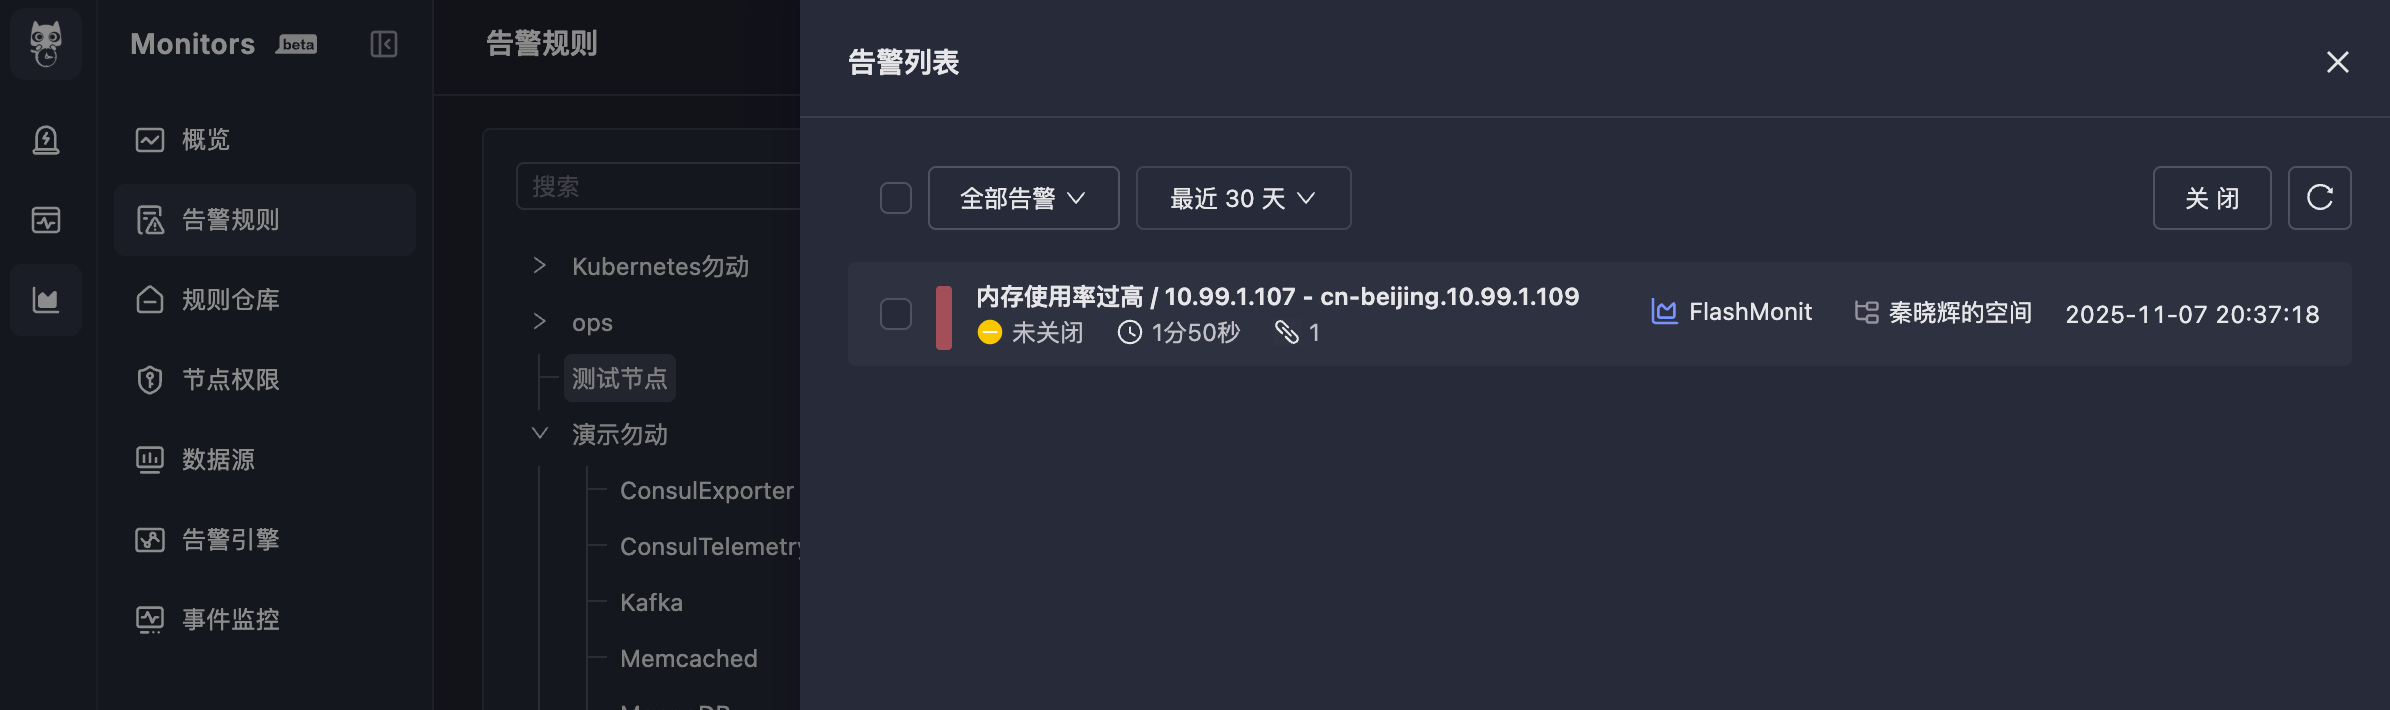
Click the alert event title to view details, which are divided into three tabs: **Alert Overview**, **Timeline**, and **Related Events**.
## Batch operations
The alert rules list supports multi-select for batch operations, improving rule management efficiency.
### Batch enable/disable/delete
After selecting multiple rules in the list, you can batch enable, batch disable, or batch delete them in one click.
### Batch edit fields
After selecting multiple rules, click **Batch Update** to uniformly modify the following 10 fields:
| Batch-editable Field | Description |
| ------------------------------ | ---------------------------------------------------- |
| **Additional Labels** | Uniformly set labels |
| **Data Sources** | Uniformly switch data sources |
| **Detection Frequency** | Uniformly adjust the detection period |
| **Rule Timezone** | Uniformly switch the IANA timezone of the alert rule |
| **Effective Time** | Uniformly configure effective time periods |
| **Query Delay** | Uniformly set query delay time |
| **Custom Fields** | Uniformly configure annotations |
| **Channel** | Uniformly specify the channel for alert delivery |
| **Repeat Notification Config** | Uniformly set repeat notification interval and count |
| **Debug Log** | Uniformly enable or disable debug logging |
How to use: In the batch update panel, first select the field to modify, then set the new value, and click OK to apply the change to all selected rules.
### Batch move
After selecting multiple rules, you can batch move them to another folder.
## Import alert rules
Monitors supports three import modes. You can choose the most suitable method based on the source.
**Menu Entry**: Alert Rules → Import
### Import from rule repository
Select the **Rule Repository** mode to import existing rule templates from the [rule repository](/en/monitors/rule-repository/rule-repository). You need to specify the channel for alert event delivery when importing.
### Import from JSON
Select the **Flashduty Rules JSON** mode and paste a JSON array of alert rules. This format is consistent with the JSON produced by the export feature, making it suitable for migrating alert rules across tenants or environments. You need to specify a channel when importing.
The JSON content must be in array format (starting with `[`), where each element is a complete alert rule definition.
### Import from Prometheus YAML
Select the **Prometheus Rules YAML** mode and paste standard Prometheus alert rules YAML content.
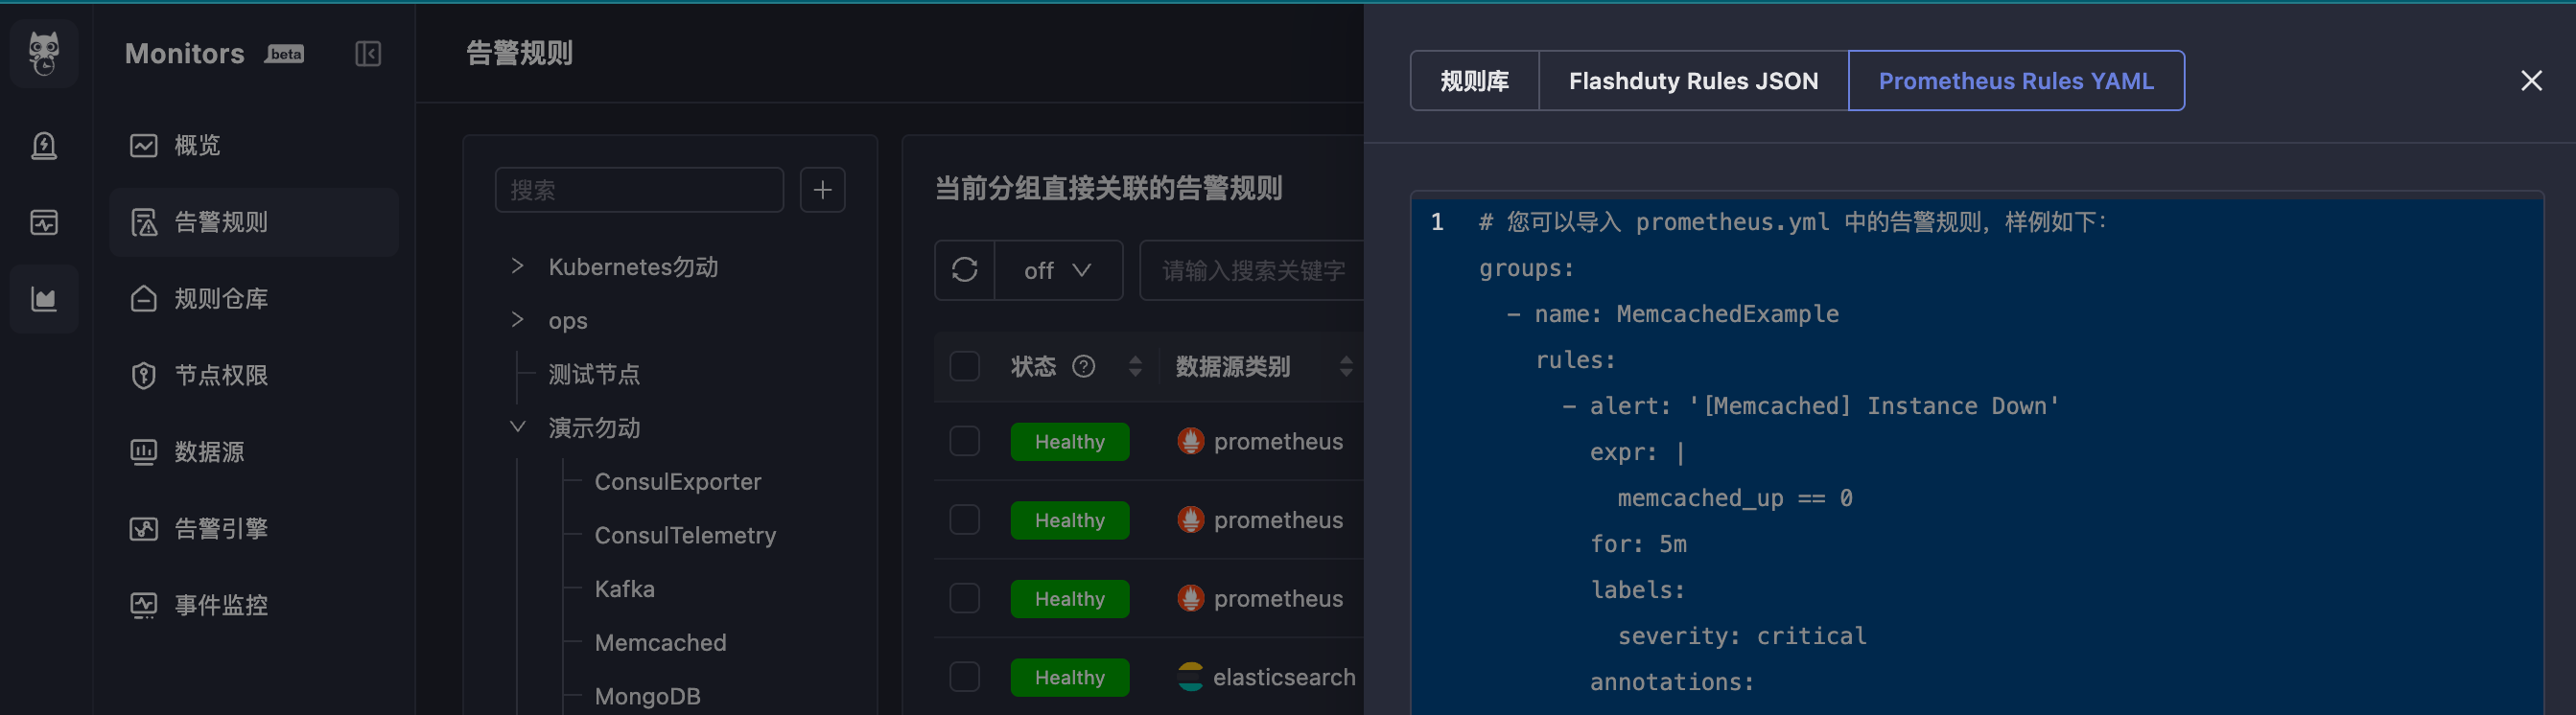
Requires standard format with `groups` as the root node. YAML indentation must be correct, otherwise import will fail. Each rule must contain `alert` and `expr` fields.
### Import results
If some rules fail to import, the system displays an import results table showing the import status and error message for each rule. When all rules succeed, a success message is displayed directly.
## Export alert rules
Select the rules to export in the list and click the **Export** button. The system displays the full configuration of the selected rules in JSON format. You can:
* **Download**: Save the JSON as a `monit.json` file
* **Copy**: Copy the JSON content to the clipboard
The exported JSON can be used for backup or imported into other environments via the JSON import mode.
## Rule change history
Every alert rule has a complete change audit trail. You can view the **Change History** in the rule details to understand the historical modifications.
### View change history
The change history list shows the following information for each operation:
| Column | Description |
| ------------------ | --------------------------------- |
| **Operation Time** | When the change occurred |
| **Operation Type** | Such as create, update, etc. |
| **Operator** | The user who performed the change |
### Version comparison
Select two records in the change history list and click the **Compare** button. The system displays the differences between the two versions in JSON diff format, helping you quickly understand which configuration items were modified.