> ## Documentation Index
> Fetch the complete documentation index at: https://docs.flashduty.com/llms.txt
> Use this file to discover all available pages before exploring further.
# Grafana Integration
> Sync Grafana alert events to Flashduty via webhook to achieve automated alert noise reduction.
Sync Grafana alert events to Flashduty via webhook to achieve automated alert noise reduction.
## In Flashduty
***
You can obtain an integration push URL through either of these two methods:
### Using Private Integration
Choose this method when you don't need to route alert events to different channels. It's simpler.
Expand
1. Go to Flashduty console, select **Channel**, and enter a channel's details page
2. Select the **Integrations** tab, click **Add Integration** to enter the integration page
3. Choose **Grafana** integration and click **Save** to generate a card
4. Click the generated card to view the **push URL**, copy it for later use, and you're done
### Using Shared Integration
Choose this method when you need to route alerts to different channels based on the alert event's payload information.
Expand
1. Go to Flashduty console, select **Integration Center=>Alert Events** to enter the integration selection page
2. Select **Grafana** integration:
* **Integration Name**: Define a name for this integration
3. Configure the default route and select the corresponding channel (after the integration is created, you can go to `Route` to configure more routing rules)
4. Click **Save** and copy the newly generated **push URL** for later use
5. Done
## In Grafana
***
Grafana V4\~V8 versions enable Legacy Alerting by default, while V9 and later versions enable Grafana Alerting by default. For feature distinctions and activation methods, please refer to the [official documentation](https://grafana.com/docs/grafana/v8.4/alerting/unified-alerting/opt-in/#opt-in-to-grafana-alerting). Follow these steps based on your deployed version.
### Legacy Alerting
1. Open your Grafana console and navigate to Alerting > Notification channels
2. Click Add Channel to open the channel configuration dialog
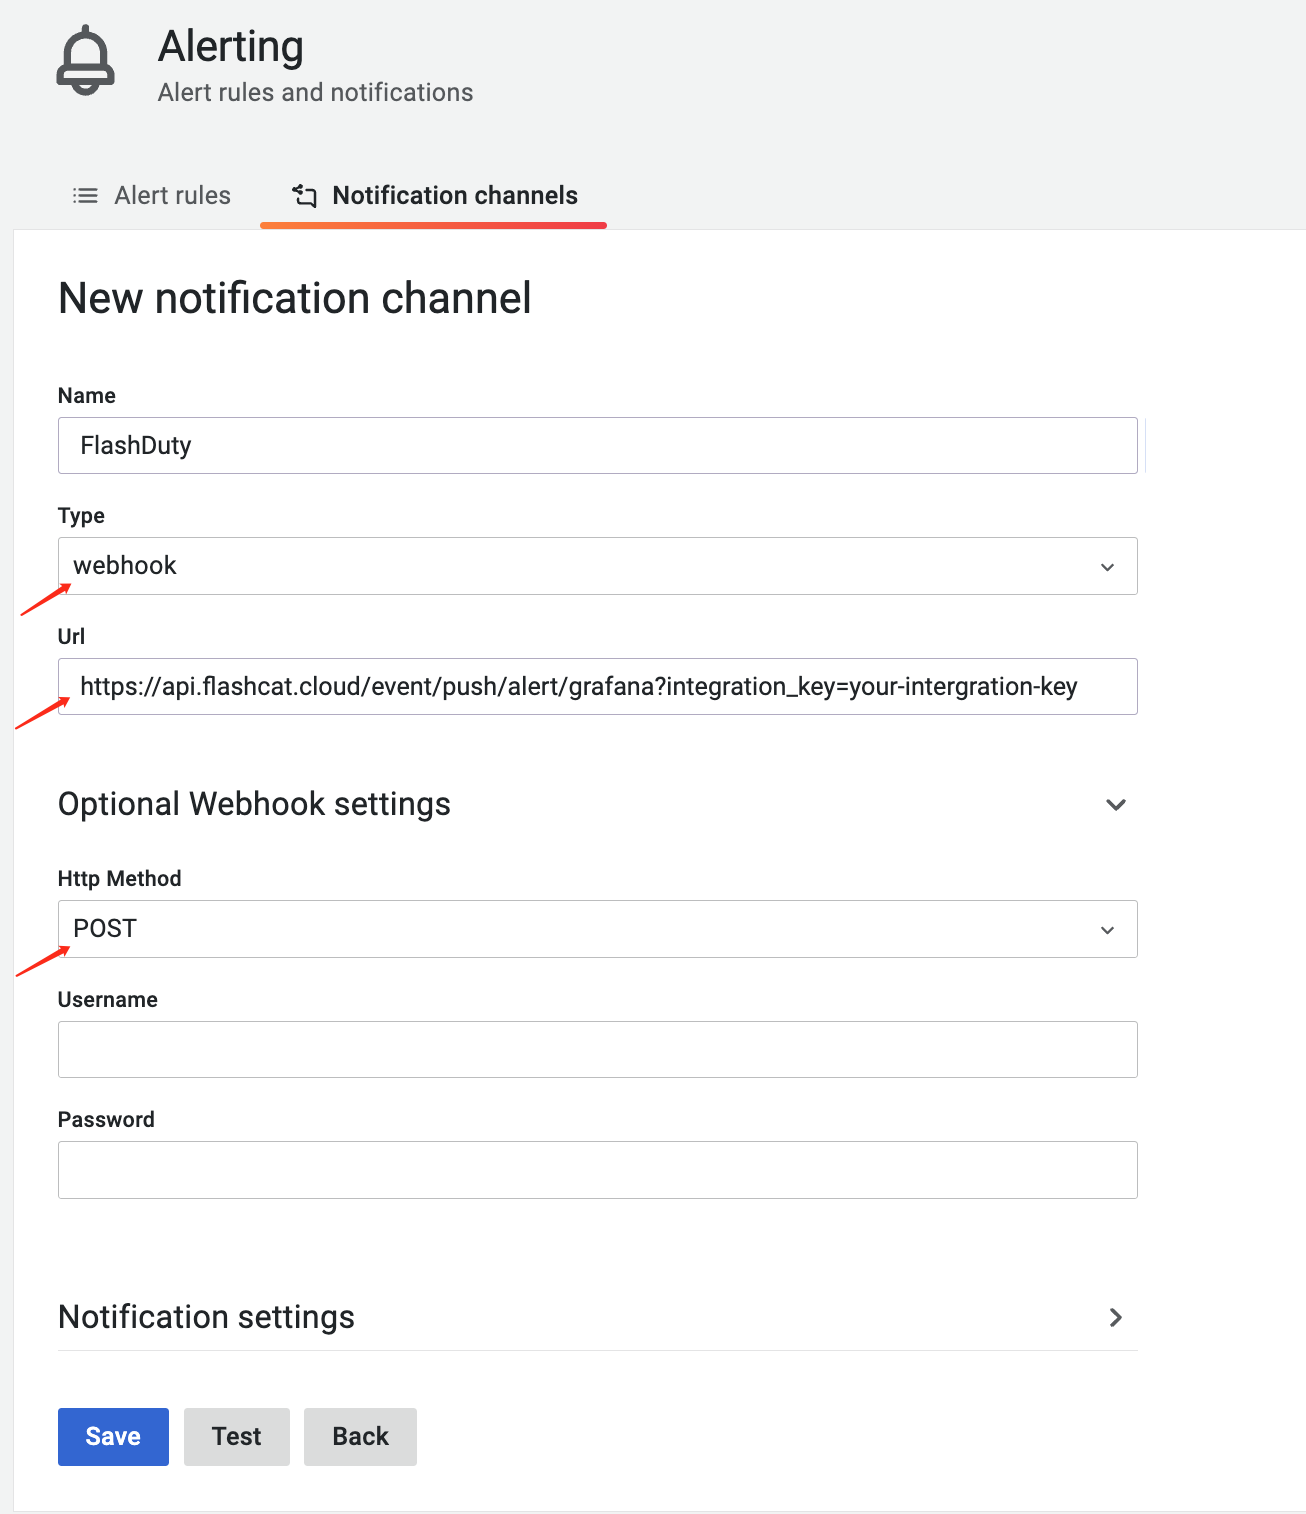
3. Configure the name, select webhook as Type, enter the integration push URL in the Url field, and select POST as Method, as shown below:
4. Save and return to the integration list. After an alert occurs, if the latest event time is displayed, the configuration is successful and events are being received
5. Complete
1. Open your Grafana console and navigate to Alerting > Contact points
2. Click New contact point to open the configuration dialog
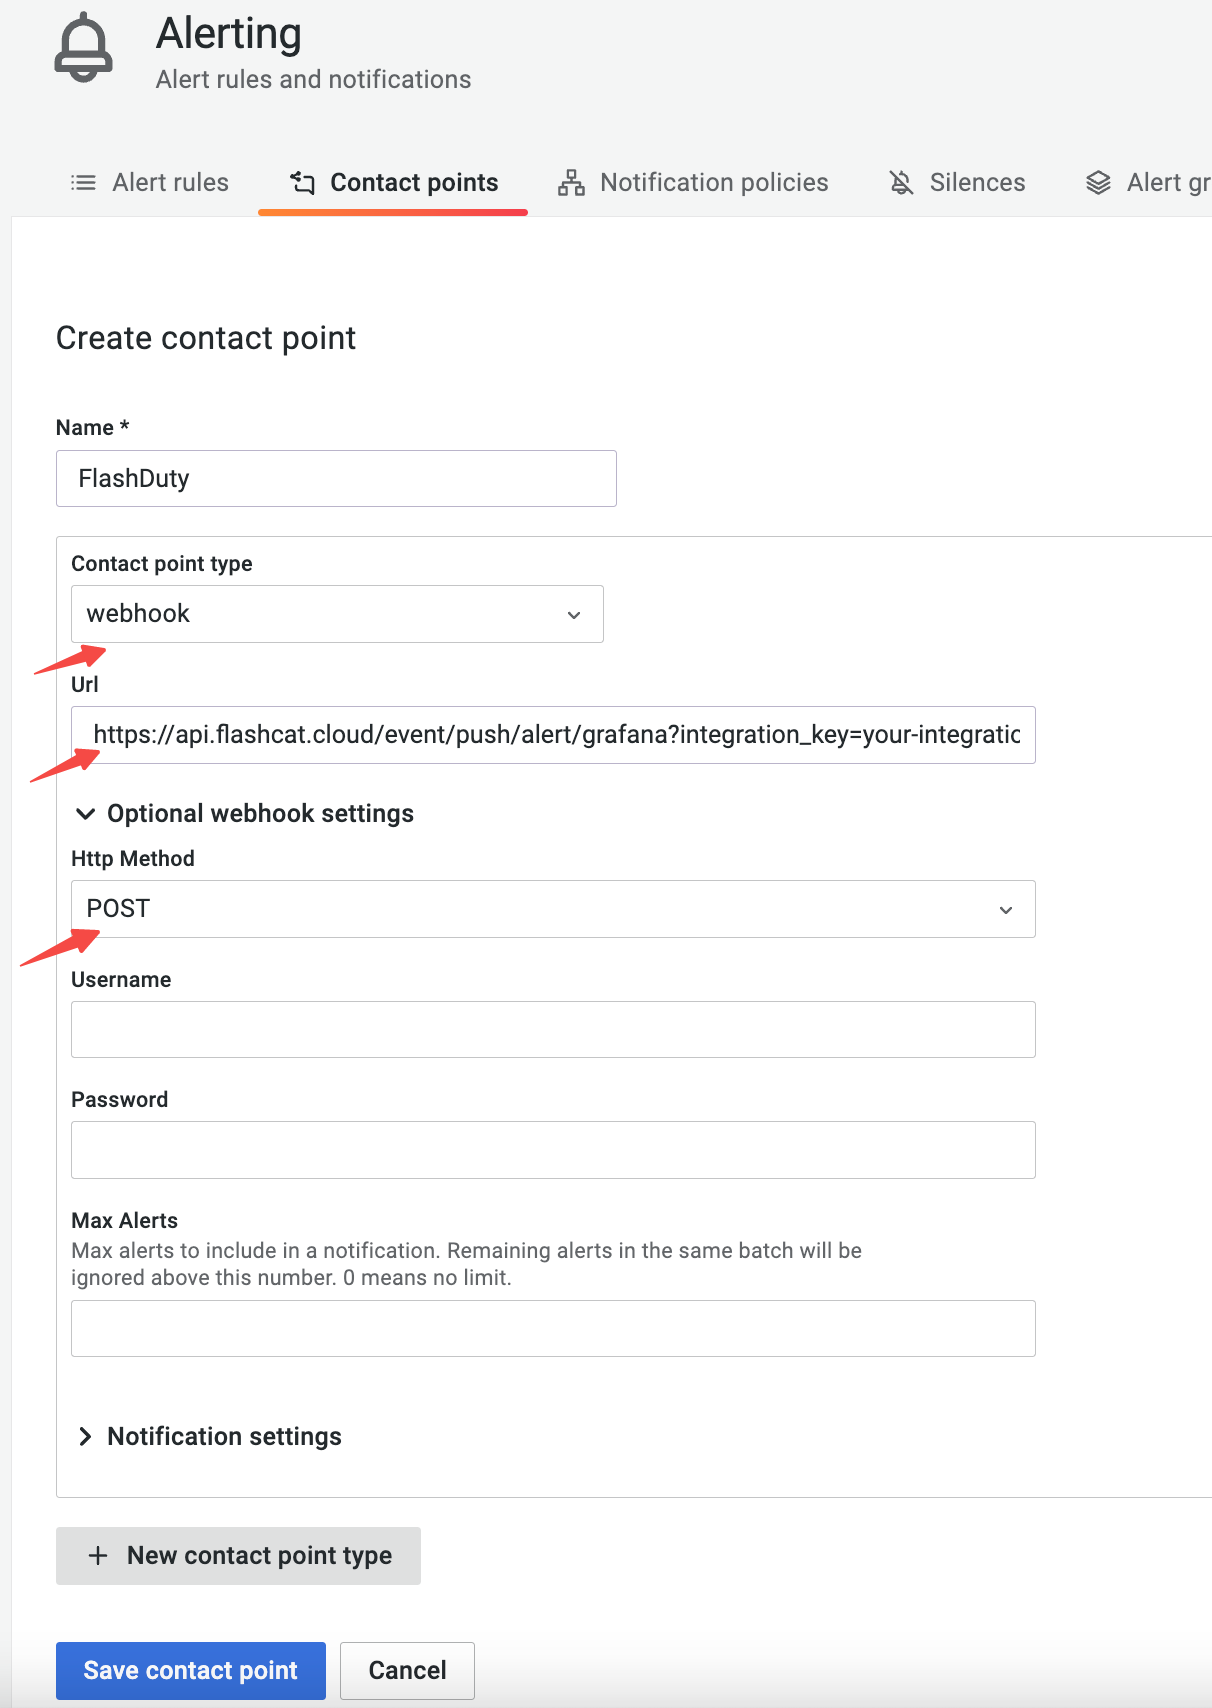
3. Configure the name, select webhook as Type, enter the integration push URL in the Url field, and select POST as Method, as shown below:
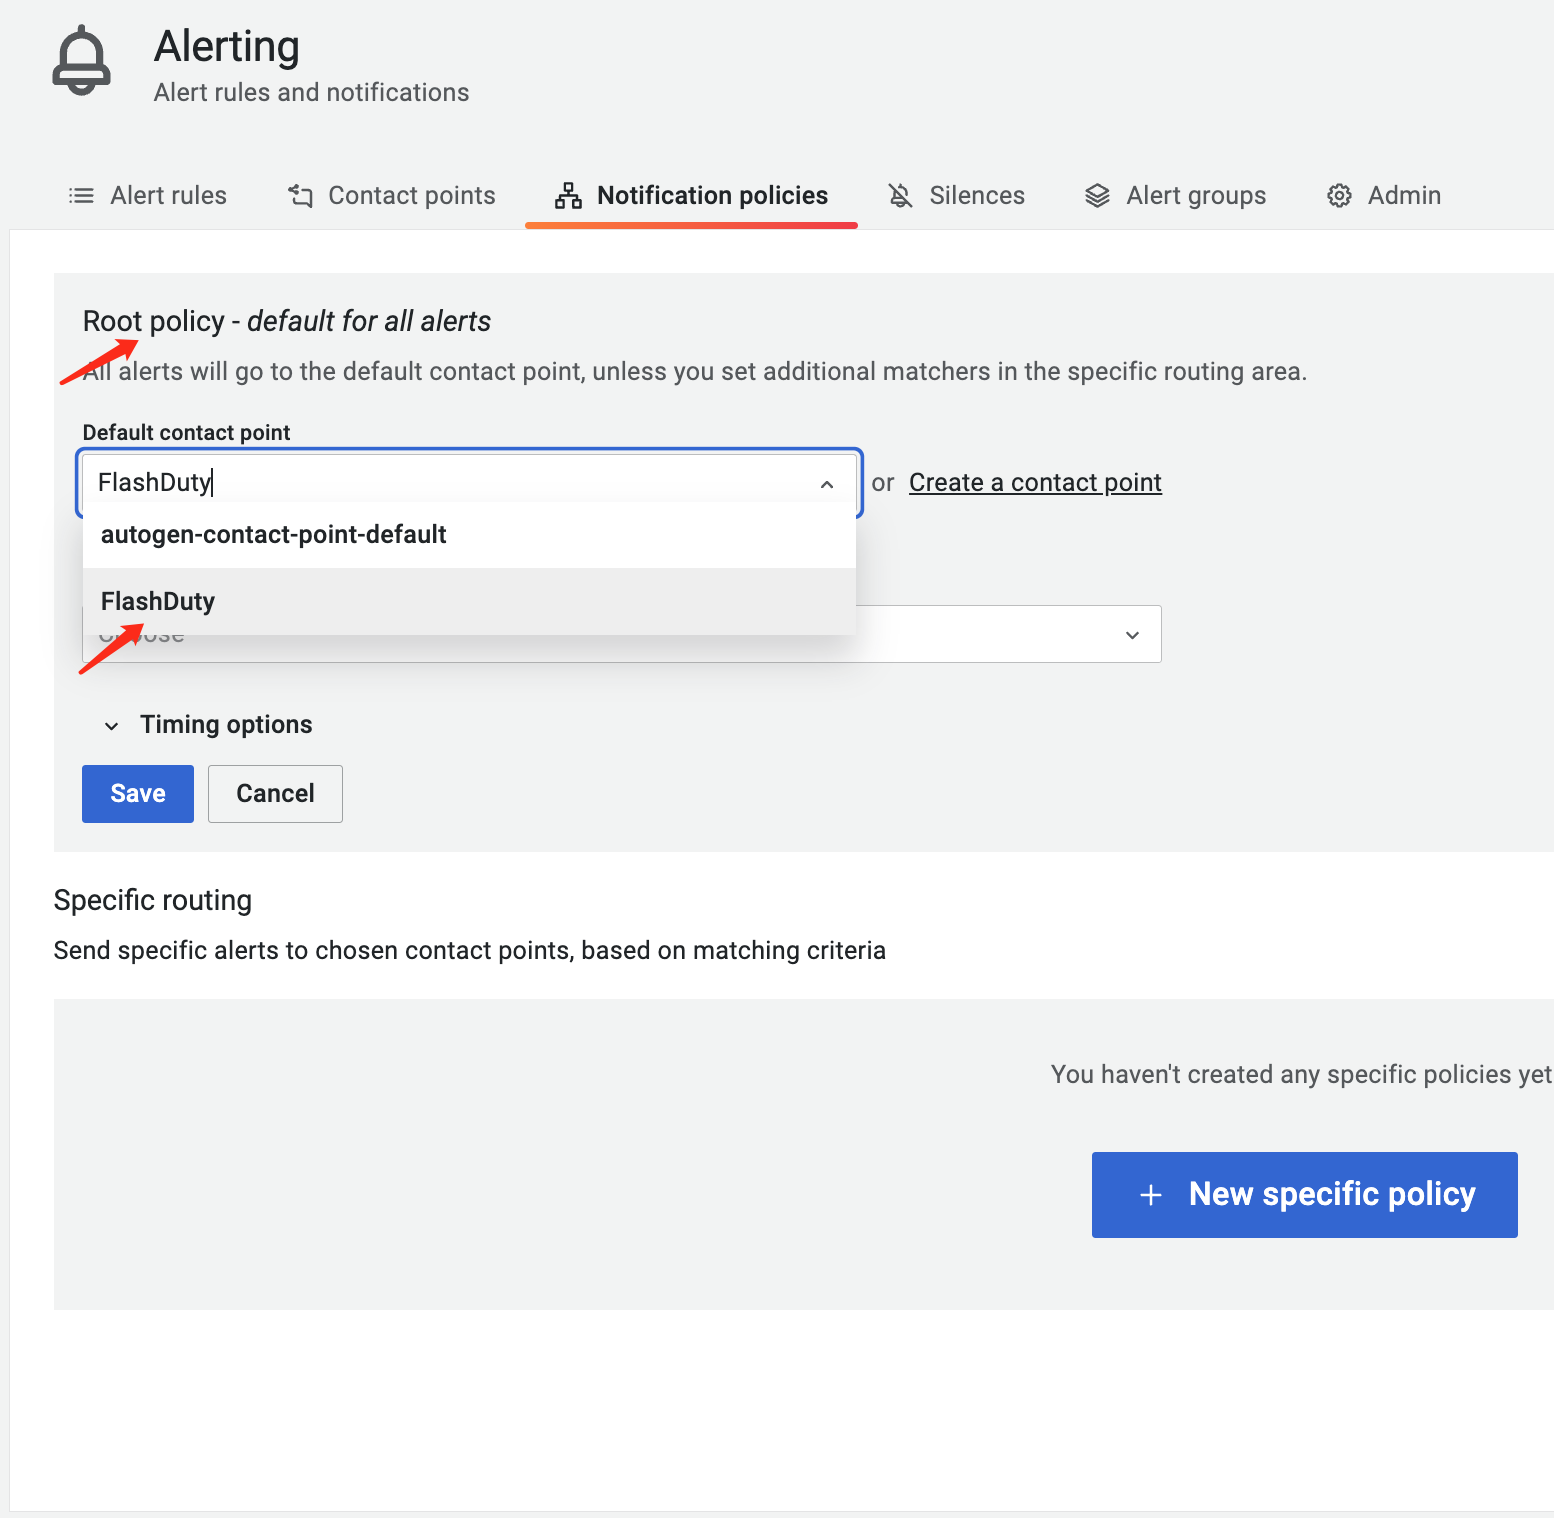
4. Open the Notification policies page, edit or add a policy as needed, and select the contact point created in the previous step as the delivery channel, as shown below:
5. Save and return to the integration list. After an alert occurs, if the latest event time is displayed, the configuration is successful and events are being received
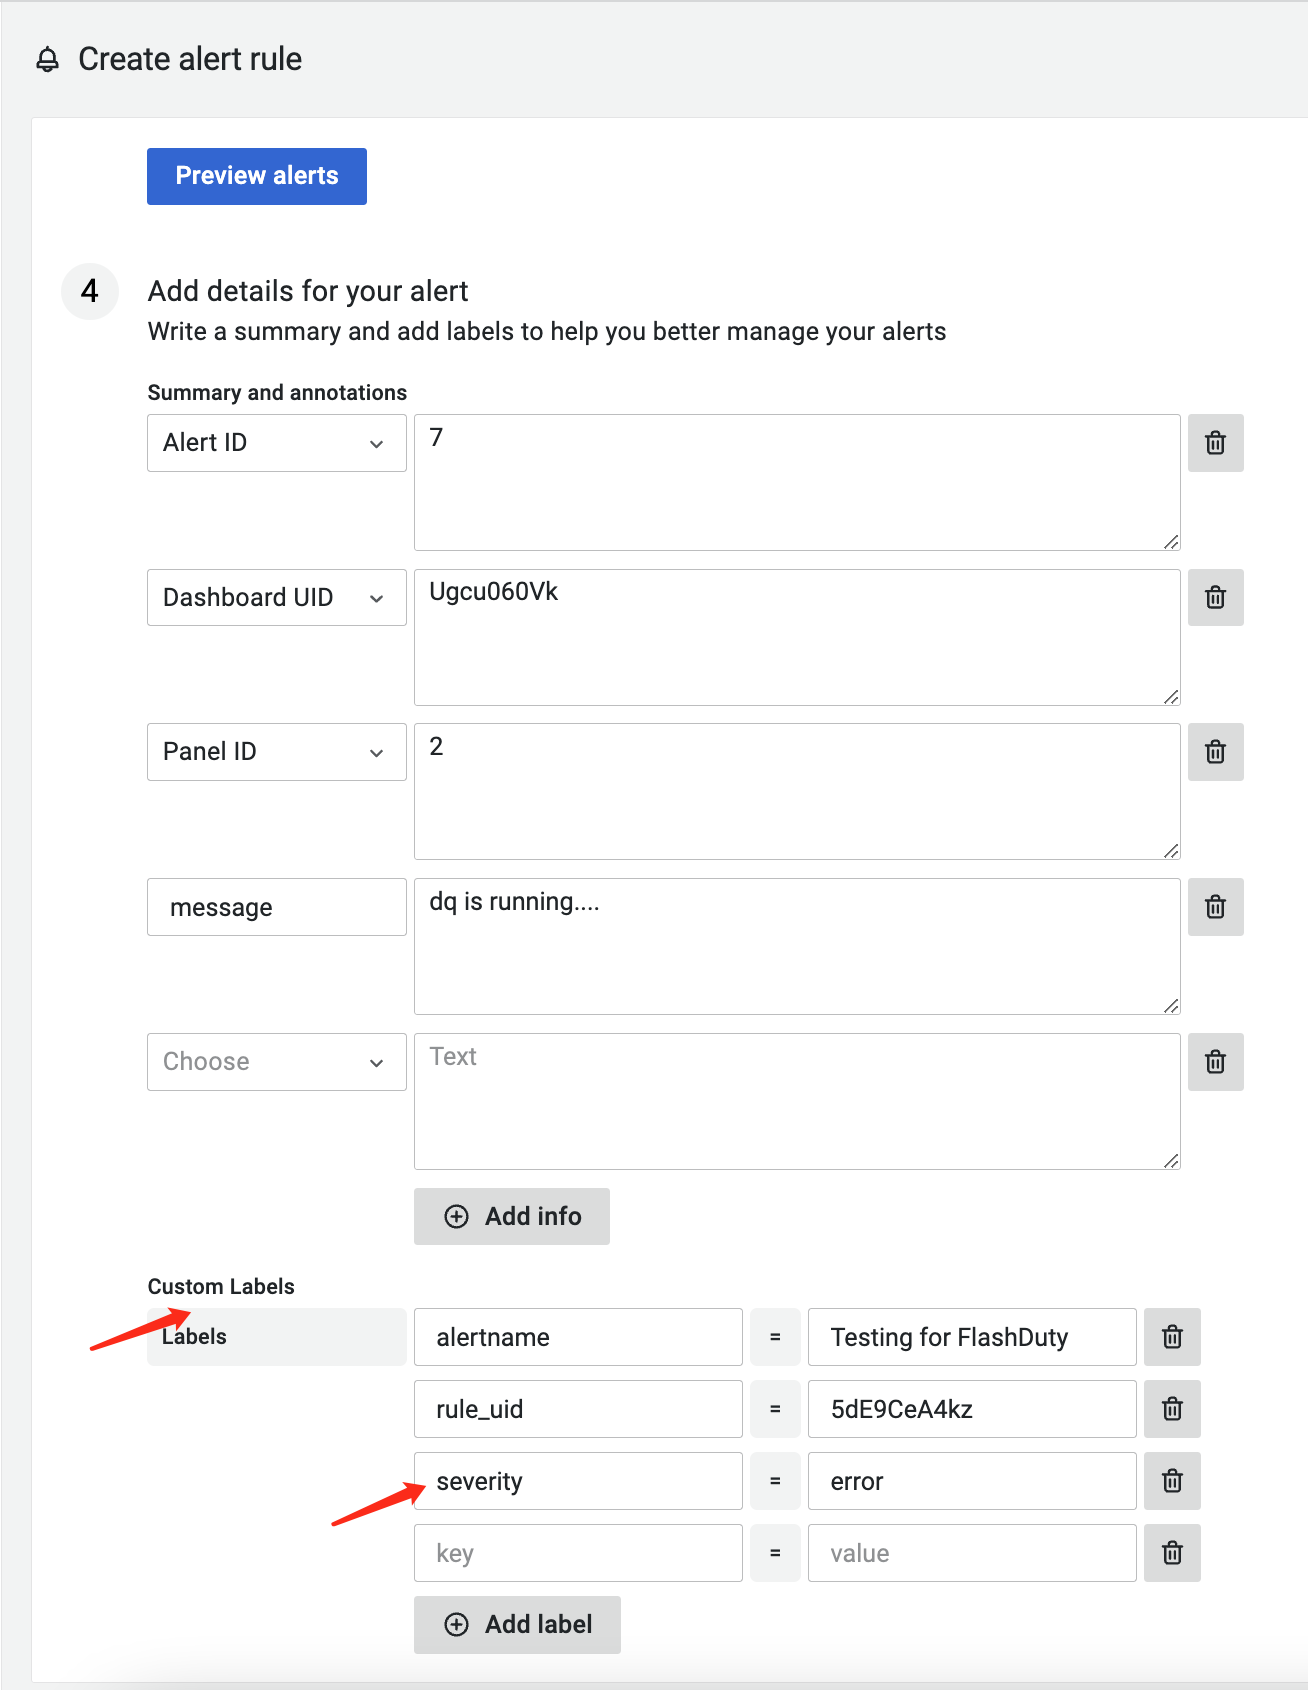
6. The default alert severity is warning. To customize it, you can configure the severity label in the alert details page (refer to the status mapping below), as shown in the following image:
7. Complete
## Status Mapping
***
Legacy Alerting to Flashduty severity mapping:
| Legacy Alerting | Flashduty | Status |
| --------------- | --------- | -------- |
| alerting | Warning | Warning |
| no\_data | Critical | Critical |
| ok | Ok | Resolved |
Grafana Alerting to Flashduty severity mapping:
The system extracts the `severity`, `priority`, and `level` labels from alert events in sequence. The corresponding value will be used as Prometheus's own alert severity. If none are found, the system automatically sets the Prometheus alert severity to `warning`.
| Grafana Alerting | Flashduty | Status |
| ---------------- | --------- | -------- |
| critical | Critical | Critical |
| warning | Warning | Warning |
| warn | Warning | Warning |
| info | Info | Info |
| acknowledged | Info | Info |
| unknown | Info | Info |
| unk | Info | Info |
| ok | Ok | Resolved |