> ## Documentation Index
> Fetch the complete documentation index at: https://docs.flashduty.com/llms.txt
> Use this file to discover all available pages before exploring further.
# Native
> Learn about the Flashduty Native (Android/iOS) RUM Insights dashboard core features for mobile app performance monitoring, error tracking, and resource analysis
Flashduty Native RUM Insights dashboard provides out-of-the-box visualization dashboards that automatically collect and analyze multi-dimensional data including user sessions, app performance, crash errors, and network requests. This helps you gain comprehensive insights into your mobile app's real-world performance, quickly identify performance bottlenecks and issues, and continuously optimize user experience.
The Insights dashboard includes 4 core analysis dimensions: **Overview**, **Performance Analysis**, **Error Analysis**, **Resource Analysis**
## Overview — Key Metrics at a Glance
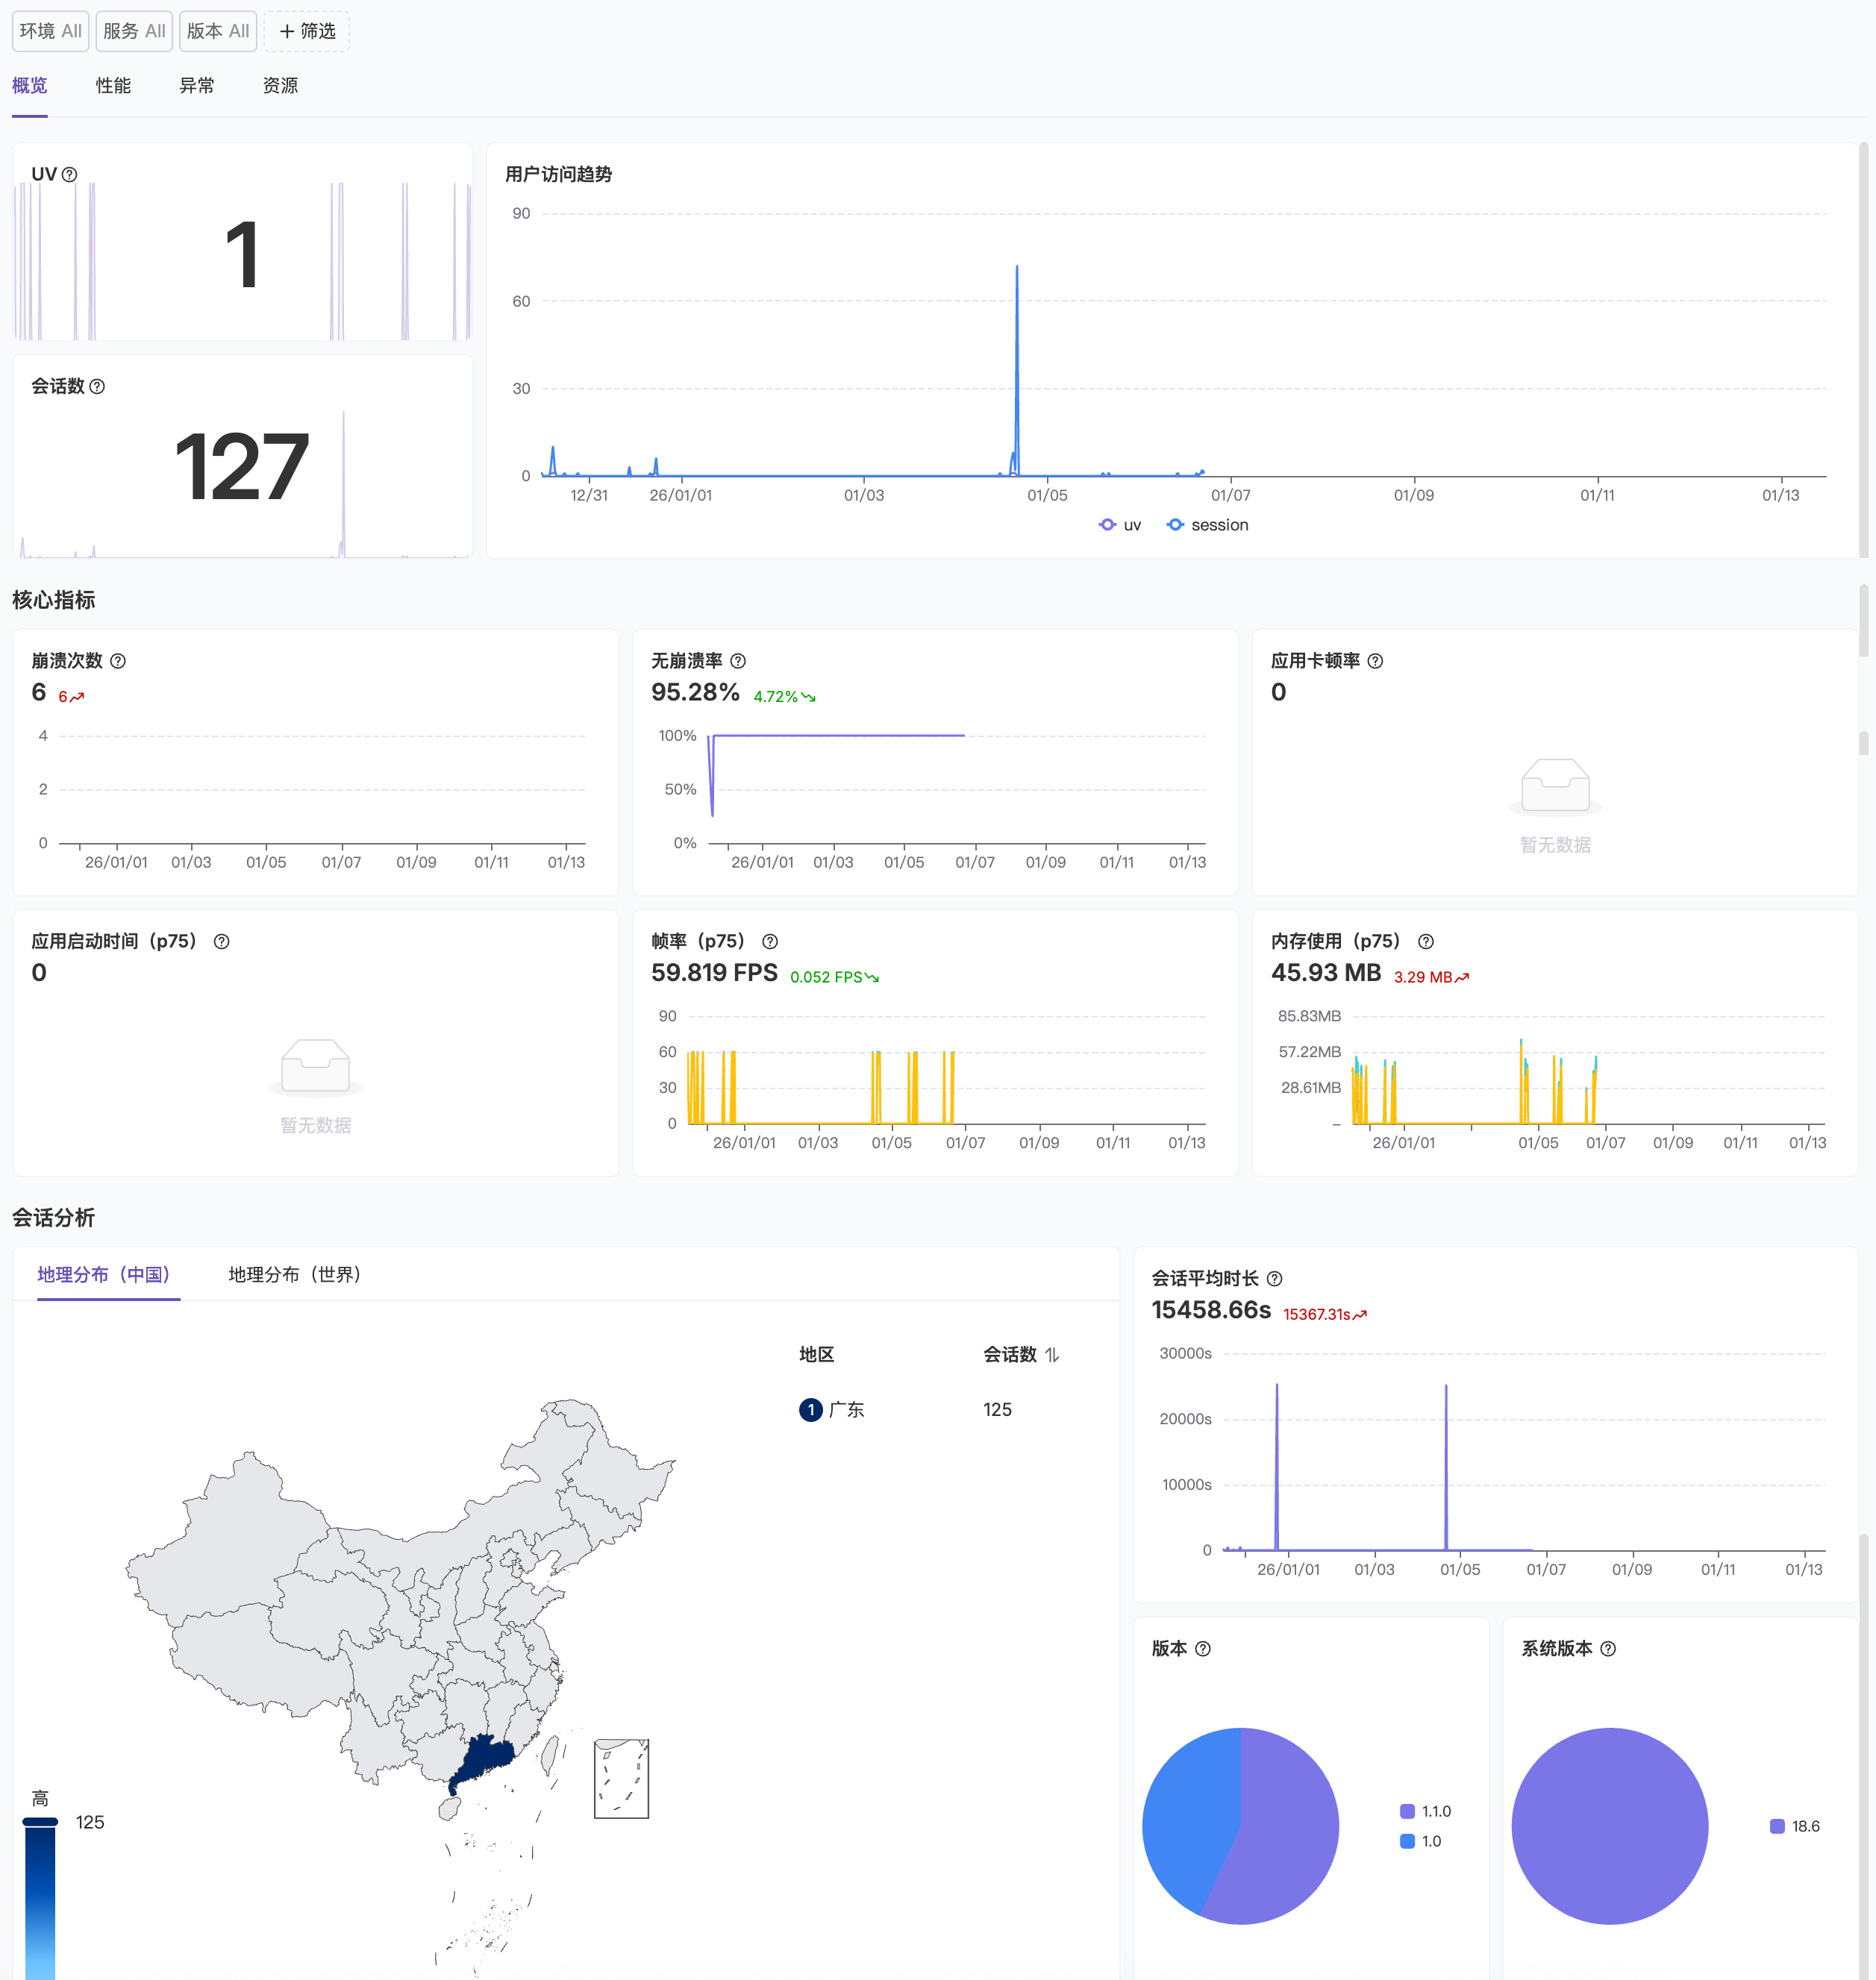 The Overview module focuses on core metrics across multiple dimensions for mobile apps:
* **Traffic Metrics** - Monitor UV (Unique Visitors) and sessions to understand overall user activity trends
* **Core Health Metrics** - Highlight three key mobile app metrics: crash count, crash-free rate, and app freeze rate for quick identification of stability issues
* **User Access Trends** - Track UV and Session trends over time through time-series charts to understand user activity patterns
* **User Distribution** - Analyze user sources by geographic location to understand regional user activity
* **Session Analysis** - Track average session duration distribution trends to evaluate user engagement and usage depth
* **Version Distribution** - Monitor user distribution across different system versions (Android/iOS) and app versions to support compatibility optimization and version iteration
## Performance Analysis — Comprehensive App Experience Monitoring
The Overview module focuses on core metrics across multiple dimensions for mobile apps:
* **Traffic Metrics** - Monitor UV (Unique Visitors) and sessions to understand overall user activity trends
* **Core Health Metrics** - Highlight three key mobile app metrics: crash count, crash-free rate, and app freeze rate for quick identification of stability issues
* **User Access Trends** - Track UV and Session trends over time through time-series charts to understand user activity patterns
* **User Distribution** - Analyze user sources by geographic location to understand regional user activity
* **Session Analysis** - Track average session duration distribution trends to evaluate user engagement and usage depth
* **Version Distribution** - Monitor user distribution across different system versions (Android/iOS) and app versions to support compatibility optimization and version iteration
## Performance Analysis — Comprehensive App Experience Monitoring
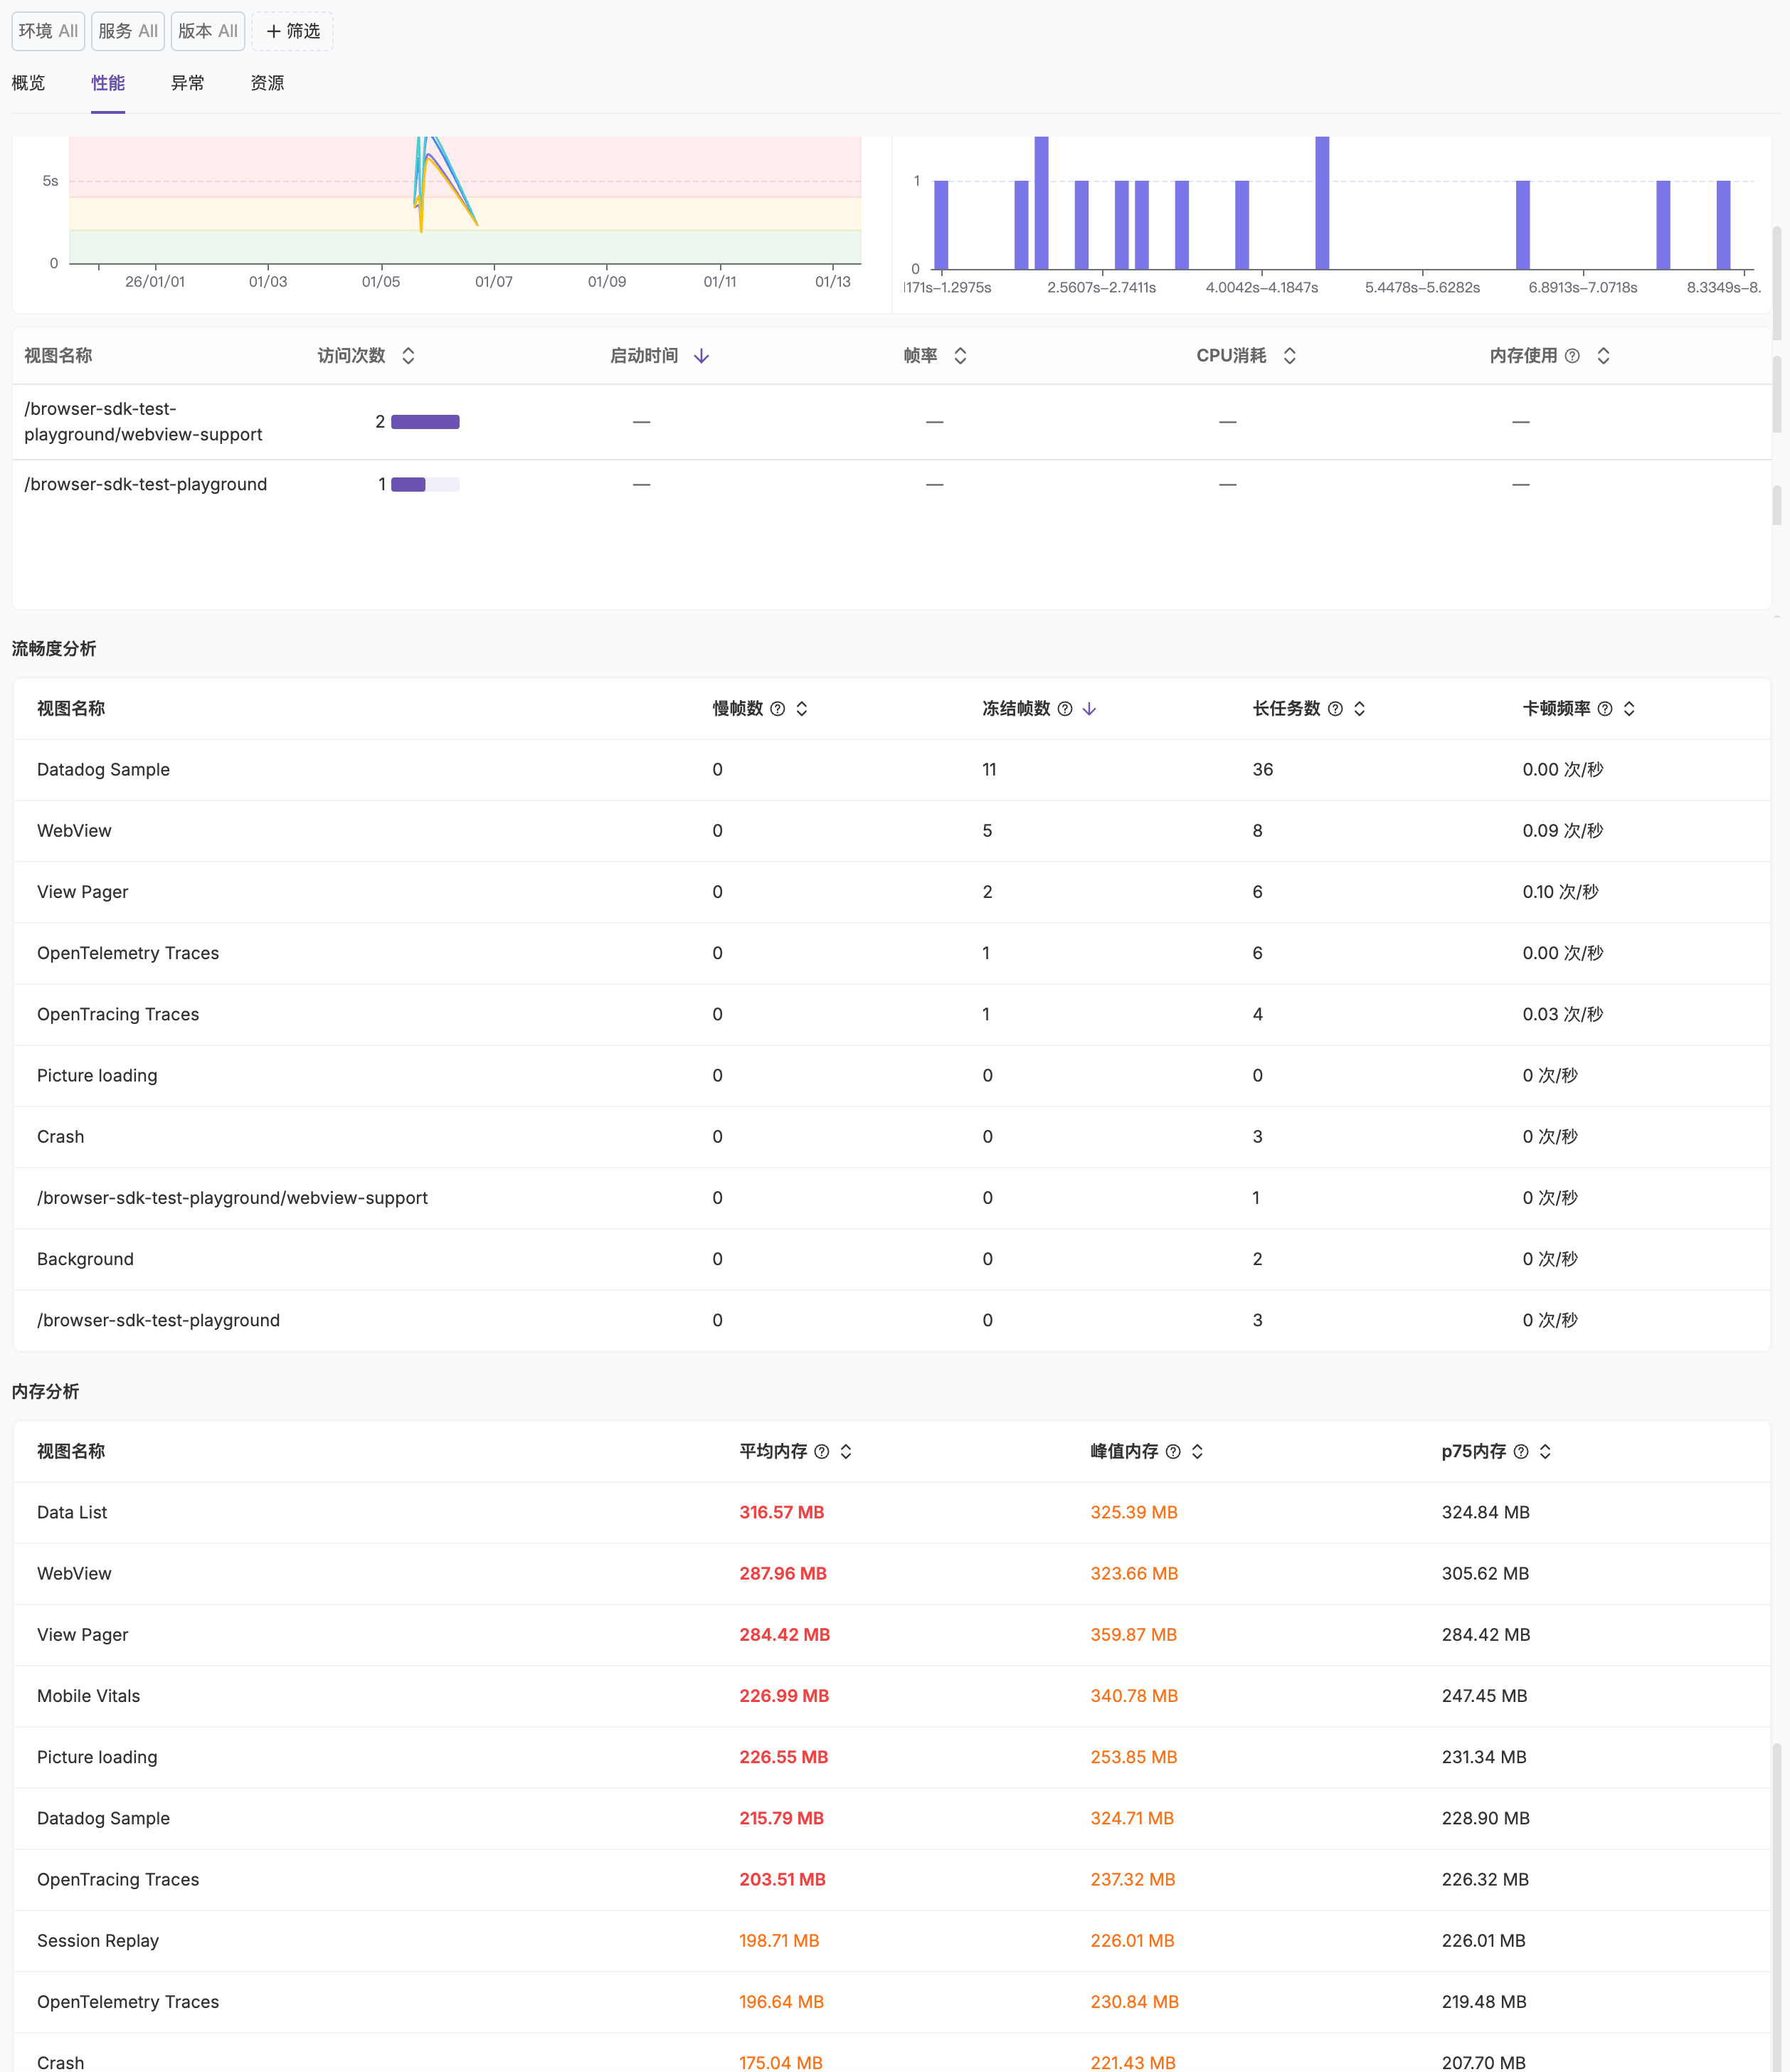 The Performance Analysis module focuses on full-chain monitoring of core experience metrics including app startup, page rendering, and interaction smoothness.
#### Core Performance Metrics
The top section displays P75 percentile values for four key performance metrics:
* **App Startup Time (P75)**: Monitor the P75 percentile of app startup duration to evaluate startup performance. Startup time directly impacts user first impressions and willingness to use the app.
* **Frame Rate (P75)**: Display the P75 percentile of runtime frame rate to measure visual smoothness. Target is 60fps; higher values indicate smoother interactions.
* **CPU Usage (P75)**: Track the P75 percentile of CPU utilization to identify compute-intensive operations. High CPU usage leads to device heating and increased battery drain.
* **Memory Usage (P75)**: Monitor the P75 percentile of app memory usage to detect memory leaks or abnormal growth early.
#### App Startup Time Analysis
* **Startup Time Trend Chart**: Shows how app startup time changes over time, helping you evaluate optimization effectiveness and detect performance regressions.
* **Sample Distribution Histogram**: Statistics of startup duration distribution by time intervals (e.g., 0.9425s-0.9642s, 1.1162s-1.1379s), providing insights into real user startup experience distribution and identifying long-tail performance issues.
#### View Performance Details
Performance metrics by view name (Page/Activity/ViewController):
* **Visit Count**: Shows visit volume for each view to identify high-frequency core pages.
* **Startup Time**: Monitor loading duration for each view to locate slow-loading pages.
* **Frame Rate**: Track runtime frame rate performance for each view to identify rendering issues.
* **CPU Usage**: Statistics of CPU utilization for each view to optimize compute-intensive pages.
* **Memory Usage**: Monitor memory usage for each view to detect memory leak risks.
#### Smoothness Analysis
App smoothness metrics by view name:
* **Slow Frames**: Count of frames with rendering time exceeding threshold (typically 16.67ms, i.e., below 60fps), identifying jank issues. Slow frames cause users to perceive noticeable UI stuttering.
* **Frozen Frames**: Count of completely frozen frames (typically exceeding 700ms), representing severe performance issues affecting user experience.
* **Long Tasks**: Count of long-running tasks on the main thread (typically threshold of 100ms or longer), locating performance bottlenecks. Long tasks block user interactions and UI updates.
* **Freeze Frequency**: Statistics of app freeze occurrence rate (per second), evaluating overall smoothness performance.
#### Memory Analysis
Memory usage details by view name:
* **Average Memory**: Shows average memory usage for each view to understand typical memory consumption levels.
* **Peak Memory**: Records peak memory usage during view runtime to identify memory pressure peaks and prevent system termination due to insufficient memory (OOM).
* **P75 Memory**: Shows the P75 percentile of memory usage, reflecting memory usage for most users, more representative of real experience than averages.
## Error Analysis — Quick Error Identification and Diagnosis
The Performance Analysis module focuses on full-chain monitoring of core experience metrics including app startup, page rendering, and interaction smoothness.
#### Core Performance Metrics
The top section displays P75 percentile values for four key performance metrics:
* **App Startup Time (P75)**: Monitor the P75 percentile of app startup duration to evaluate startup performance. Startup time directly impacts user first impressions and willingness to use the app.
* **Frame Rate (P75)**: Display the P75 percentile of runtime frame rate to measure visual smoothness. Target is 60fps; higher values indicate smoother interactions.
* **CPU Usage (P75)**: Track the P75 percentile of CPU utilization to identify compute-intensive operations. High CPU usage leads to device heating and increased battery drain.
* **Memory Usage (P75)**: Monitor the P75 percentile of app memory usage to detect memory leaks or abnormal growth early.
#### App Startup Time Analysis
* **Startup Time Trend Chart**: Shows how app startup time changes over time, helping you evaluate optimization effectiveness and detect performance regressions.
* **Sample Distribution Histogram**: Statistics of startup duration distribution by time intervals (e.g., 0.9425s-0.9642s, 1.1162s-1.1379s), providing insights into real user startup experience distribution and identifying long-tail performance issues.
#### View Performance Details
Performance metrics by view name (Page/Activity/ViewController):
* **Visit Count**: Shows visit volume for each view to identify high-frequency core pages.
* **Startup Time**: Monitor loading duration for each view to locate slow-loading pages.
* **Frame Rate**: Track runtime frame rate performance for each view to identify rendering issues.
* **CPU Usage**: Statistics of CPU utilization for each view to optimize compute-intensive pages.
* **Memory Usage**: Monitor memory usage for each view to detect memory leak risks.
#### Smoothness Analysis
App smoothness metrics by view name:
* **Slow Frames**: Count of frames with rendering time exceeding threshold (typically 16.67ms, i.e., below 60fps), identifying jank issues. Slow frames cause users to perceive noticeable UI stuttering.
* **Frozen Frames**: Count of completely frozen frames (typically exceeding 700ms), representing severe performance issues affecting user experience.
* **Long Tasks**: Count of long-running tasks on the main thread (typically threshold of 100ms or longer), locating performance bottlenecks. Long tasks block user interactions and UI updates.
* **Freeze Frequency**: Statistics of app freeze occurrence rate (per second), evaluating overall smoothness performance.
#### Memory Analysis
Memory usage details by view name:
* **Average Memory**: Shows average memory usage for each view to understand typical memory consumption levels.
* **Peak Memory**: Records peak memory usage during view runtime to identify memory pressure peaks and prevent system termination due to insufficient memory (OOM).
* **P75 Memory**: Shows the P75 percentile of memory usage, reflecting memory usage for most users, more representative of real experience than averages.
## Error Analysis — Quick Error Identification and Diagnosis
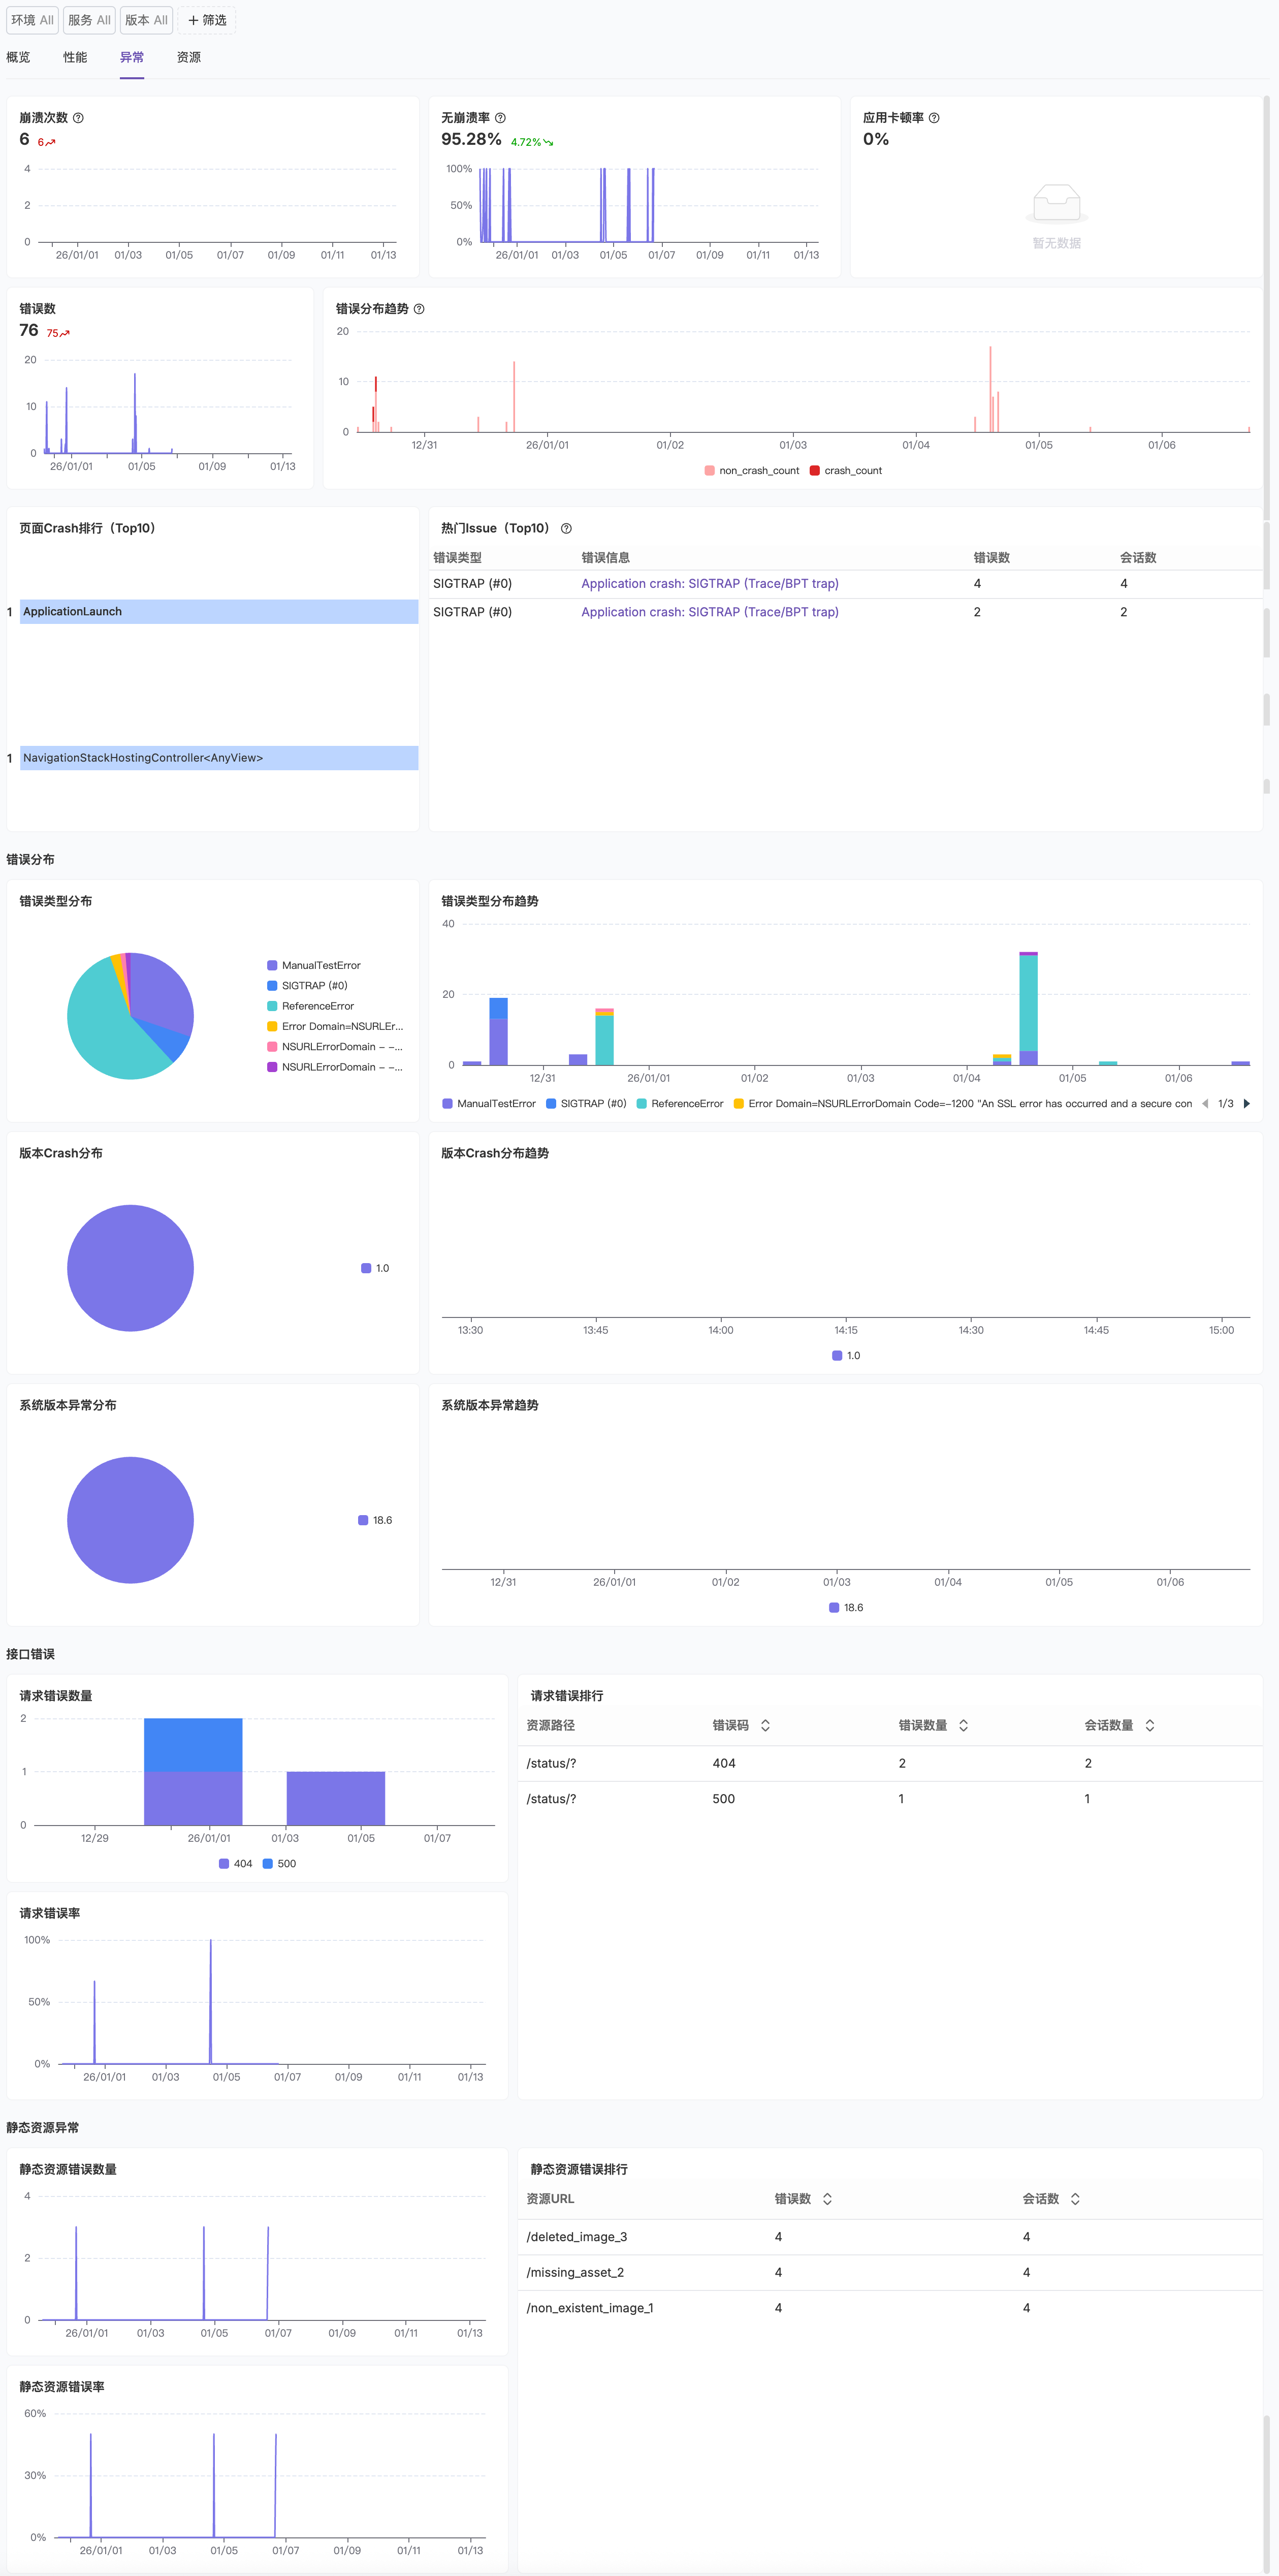 The Error Analysis module provides comprehensive error monitoring and diagnosis capabilities.
#### Core Stability Metrics
* **Crash Count**: Monitor total crash occurrences and trends to detect abnormal spikes early. Crashes force app termination and severely impact user experience.
* **Crash-free Rate**: Track the percentage of crash-free sessions to evaluate overall app stability. Industry standard recommends maintaining crash-free rate above 99.5%.
* **ANR Rate**: Statistics of Android Application Not Responding occurrence rate. ANR indicates the app's main thread has been blocked for more than 5 seconds, causing users to see the "App Not Responding" dialog.
* **App Freeze Rate**: Monitor the percentage of sessions with freezes relative to total sessions, evaluating the impact scope of app smoothness issues. Freezes typically refer to UI freezing, response delays, or frame rate drops caused by long main thread blocking, affecting user interaction experience.
#### Error Statistics
* **Error Count**: Shows total error count and time-series trends to understand overall app health changes.
* **Error Type Distribution Trend Chart**: Stacked area chart showing distribution changes of crash errors (crash\_count) and non-crash errors (non\_crash\_count) over time, quickly identifying abnormal periods and error type change trends.
* **Crash Errors (crash\_count)**: Severe errors causing forced app termination
* **Non-crash Errors (non\_crash\_count)**: Caught exceptions where the app can continue running but functionality may be affected
#### Page Crash Ranking (Top 10)
Lists pages or view controllers with the most crashes, each record containing:
* **Error Type**: Exception type of the crash (e.g., java.lang.RuntimeException, SIGTRAP, etc.)
* **Error Message**: Detailed error description to help quickly locate the issue
* **Error Count**: Total occurrences of this error on this page
* **Session Count**: Number of sessions (user visits) affected by this error
This ranking helps you prioritize the most impactful page crash issues.
#### Top Issues (Top 10)
Shows ranking of issues affecting the most users. Each Issue is an aggregated collection of errors containing:
* **Error Type**: Primary error type of the Issue (e.g., java.lang.RuntimeException, TypeError, ReferenceError, etc.)
* **Error Message**: Typical error description of the Issue; click to view detailed stack traces and session information
* **Error Count**: Total error occurrences in this Issue
* **Session Count**: Number of sessions affected by this Issue
**Note**: An Issue may aggregate multiple errors with the same root cause. For Issue aggregation strategy, see [Error Grouping](/en/rum/error-tracking/error-aggregation).
#### Error Type Distribution
* **Error Type Proportion (Pie Chart)**: Shows proportion of different error types (e.g., ReferenceError, java.lang.RuntimeException, etc.) to quickly identify main error sources.
* **Error Type Distribution Trend (Stacked Area Chart)**: Monitor changes in each error type over time to detect new error types or abnormal growth of certain errors.
#### Version Crash Distribution
* **Version Crash Distribution (Pie Chart)**: Statistics of crash distribution across different app versions to identify high-risk versions.
* **Version Crash Distribution Trend (Stacked Area Chart)**: Monitor crash changes across versions over time to evaluate new version quality and perform hotfixes or rollbacks when necessary.
#### System Version Error Distribution
* **System Version Error Distribution (Pie Chart)**: Statistics of error distribution across different OS versions (e.g., Android 11, Android 12, iOS 15, etc.) to identify system compatibility issues.
* **System Version Error Trend (Stacked Area Chart)**: Monitor error changes across system versions over time to support system compatibility optimization.
For in-depth analysis of specific errors, see [Error Tracking](/en/rum/error-tracking/overview) to learn how to investigate critical errors, view error stacks, track new error occurrences, and verify fixes.
## Resource Analysis — Fine-grained Network Performance Optimization
The Error Analysis module provides comprehensive error monitoring and diagnosis capabilities.
#### Core Stability Metrics
* **Crash Count**: Monitor total crash occurrences and trends to detect abnormal spikes early. Crashes force app termination and severely impact user experience.
* **Crash-free Rate**: Track the percentage of crash-free sessions to evaluate overall app stability. Industry standard recommends maintaining crash-free rate above 99.5%.
* **ANR Rate**: Statistics of Android Application Not Responding occurrence rate. ANR indicates the app's main thread has been blocked for more than 5 seconds, causing users to see the "App Not Responding" dialog.
* **App Freeze Rate**: Monitor the percentage of sessions with freezes relative to total sessions, evaluating the impact scope of app smoothness issues. Freezes typically refer to UI freezing, response delays, or frame rate drops caused by long main thread blocking, affecting user interaction experience.
#### Error Statistics
* **Error Count**: Shows total error count and time-series trends to understand overall app health changes.
* **Error Type Distribution Trend Chart**: Stacked area chart showing distribution changes of crash errors (crash\_count) and non-crash errors (non\_crash\_count) over time, quickly identifying abnormal periods and error type change trends.
* **Crash Errors (crash\_count)**: Severe errors causing forced app termination
* **Non-crash Errors (non\_crash\_count)**: Caught exceptions where the app can continue running but functionality may be affected
#### Page Crash Ranking (Top 10)
Lists pages or view controllers with the most crashes, each record containing:
* **Error Type**: Exception type of the crash (e.g., java.lang.RuntimeException, SIGTRAP, etc.)
* **Error Message**: Detailed error description to help quickly locate the issue
* **Error Count**: Total occurrences of this error on this page
* **Session Count**: Number of sessions (user visits) affected by this error
This ranking helps you prioritize the most impactful page crash issues.
#### Top Issues (Top 10)
Shows ranking of issues affecting the most users. Each Issue is an aggregated collection of errors containing:
* **Error Type**: Primary error type of the Issue (e.g., java.lang.RuntimeException, TypeError, ReferenceError, etc.)
* **Error Message**: Typical error description of the Issue; click to view detailed stack traces and session information
* **Error Count**: Total error occurrences in this Issue
* **Session Count**: Number of sessions affected by this Issue
**Note**: An Issue may aggregate multiple errors with the same root cause. For Issue aggregation strategy, see [Error Grouping](/en/rum/error-tracking/error-aggregation).
#### Error Type Distribution
* **Error Type Proportion (Pie Chart)**: Shows proportion of different error types (e.g., ReferenceError, java.lang.RuntimeException, etc.) to quickly identify main error sources.
* **Error Type Distribution Trend (Stacked Area Chart)**: Monitor changes in each error type over time to detect new error types or abnormal growth of certain errors.
#### Version Crash Distribution
* **Version Crash Distribution (Pie Chart)**: Statistics of crash distribution across different app versions to identify high-risk versions.
* **Version Crash Distribution Trend (Stacked Area Chart)**: Monitor crash changes across versions over time to evaluate new version quality and perform hotfixes or rollbacks when necessary.
#### System Version Error Distribution
* **System Version Error Distribution (Pie Chart)**: Statistics of error distribution across different OS versions (e.g., Android 11, Android 12, iOS 15, etc.) to identify system compatibility issues.
* **System Version Error Trend (Stacked Area Chart)**: Monitor error changes across system versions over time to support system compatibility optimization.
For in-depth analysis of specific errors, see [Error Tracking](/en/rum/error-tracking/overview) to learn how to investigate critical errors, view error stacks, track new error occurrences, and verify fixes.
## Resource Analysis — Fine-grained Network Performance Optimization
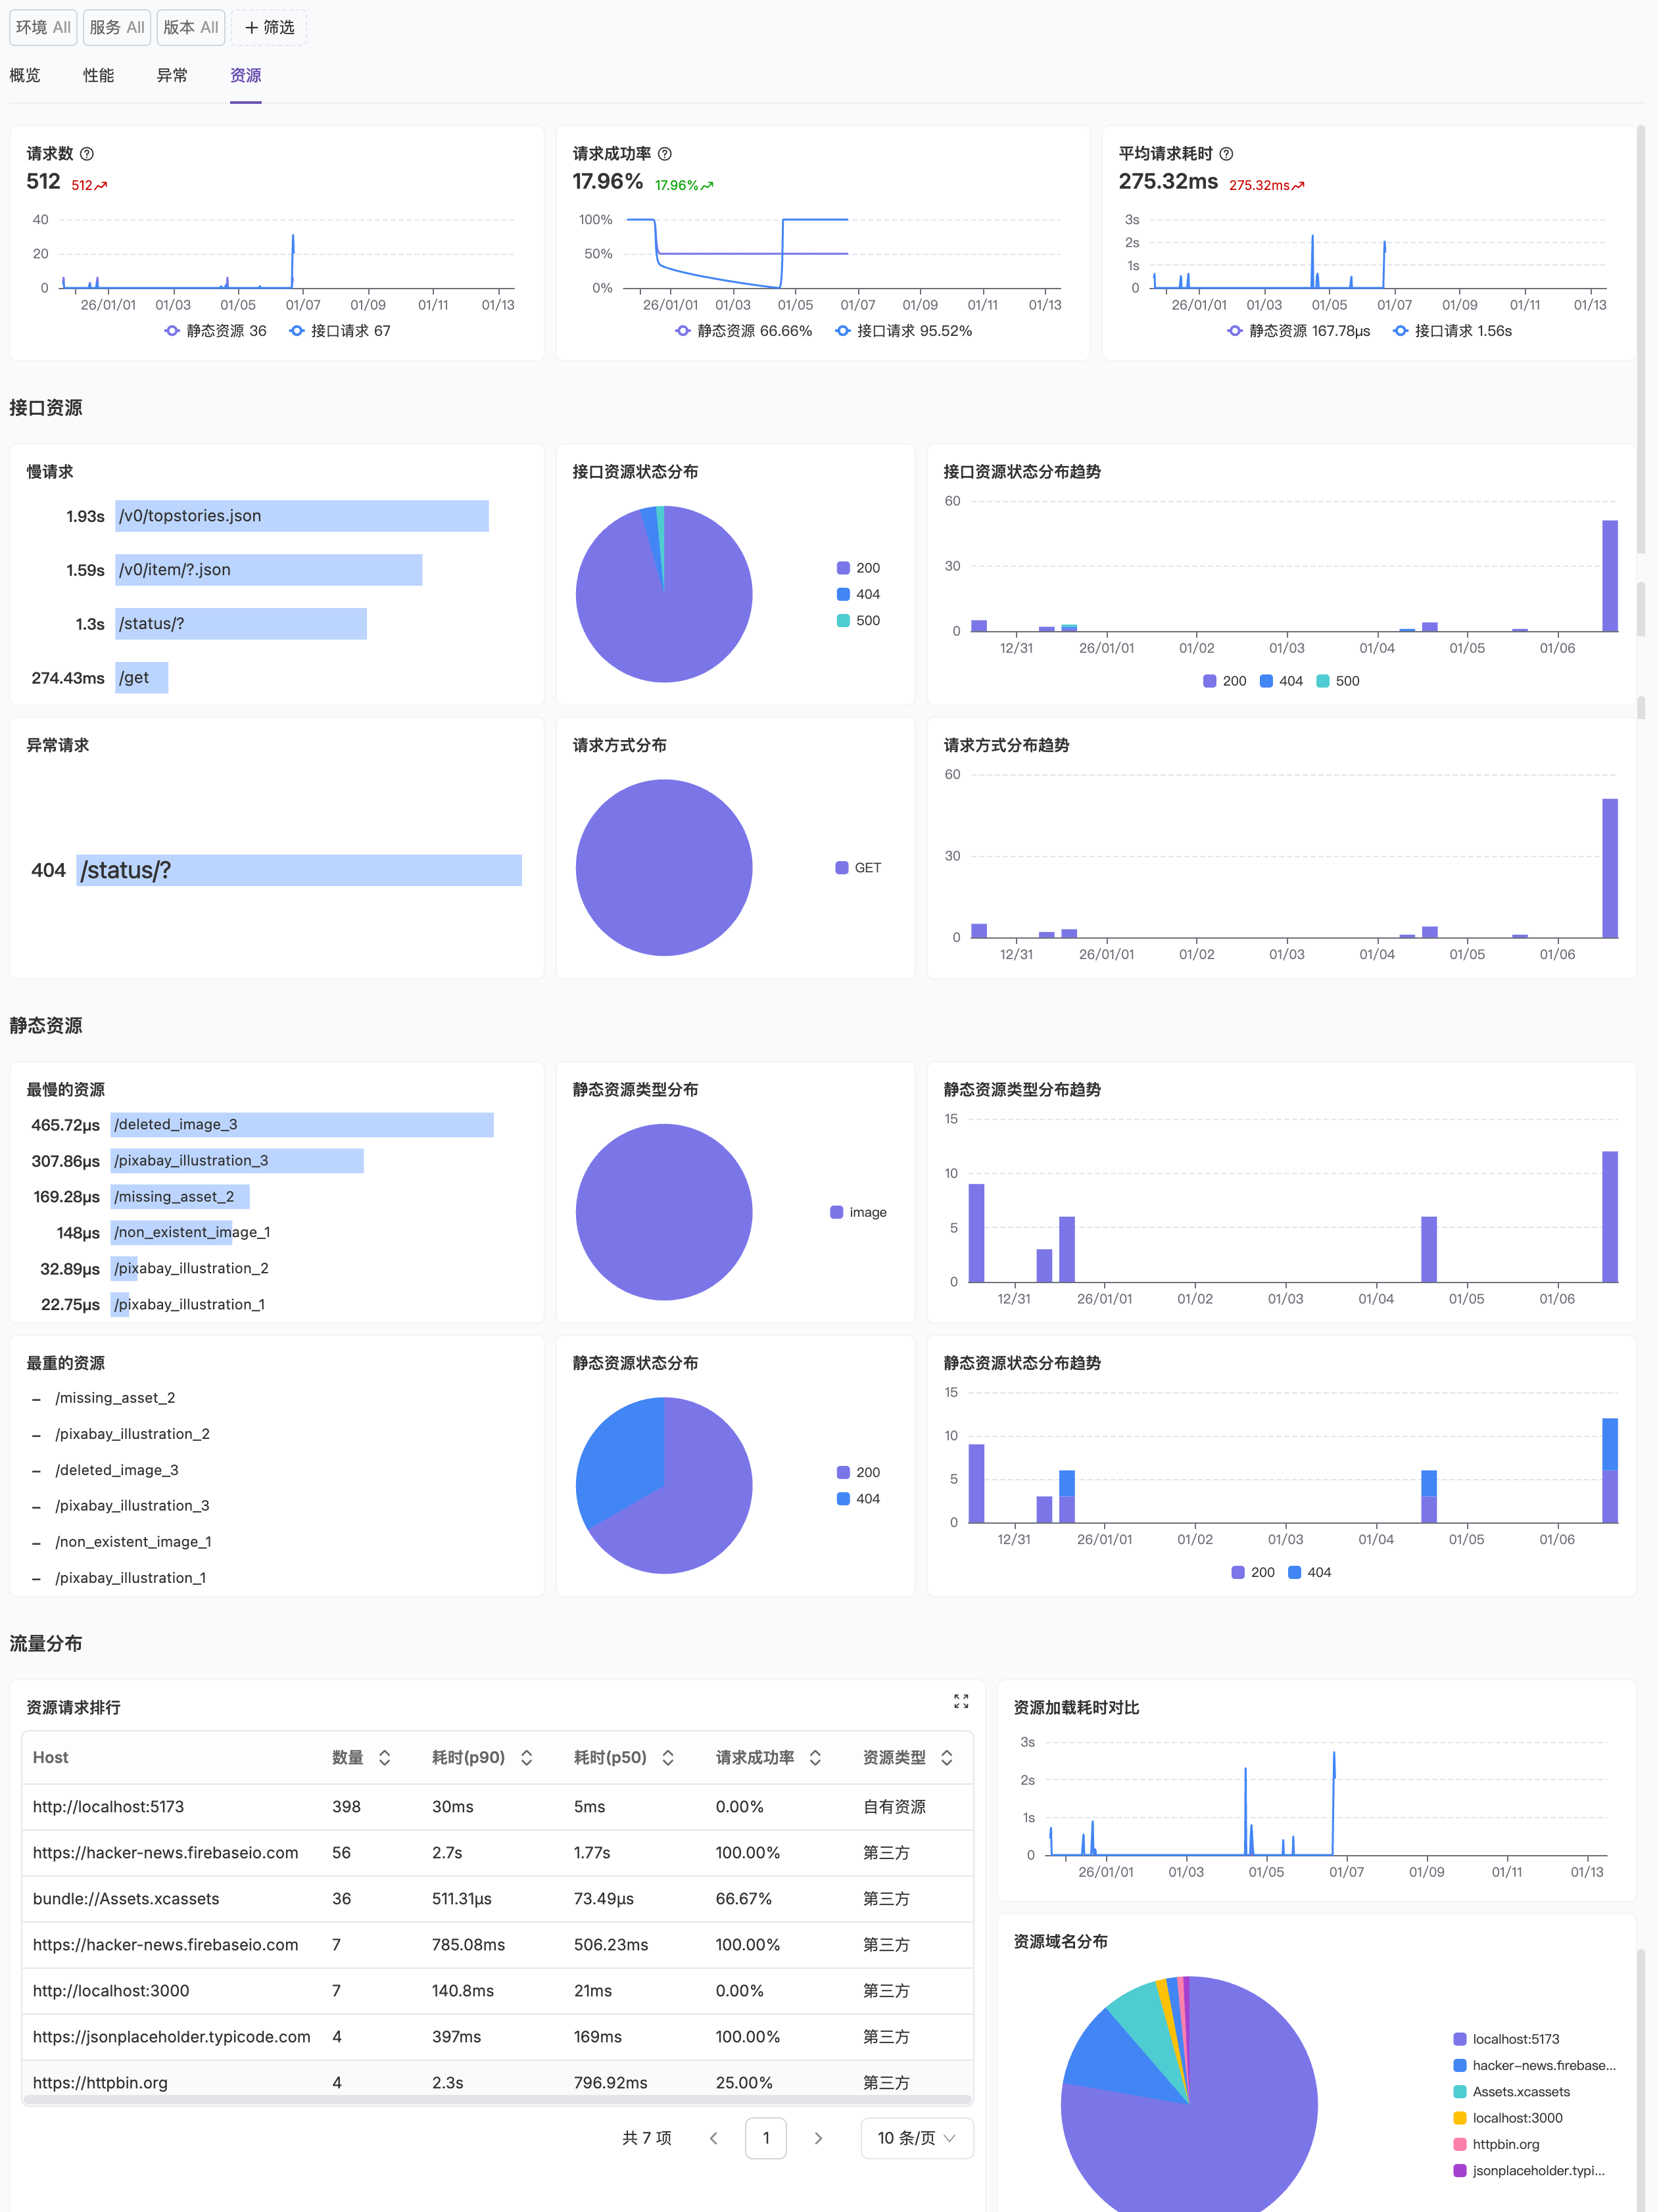 The Resource Analysis module helps you gain deep insights into your app's network request performance and identify optimization opportunities:
* **Request Count**: Monitor network request volume trends to understand app network activity.
* **Request Success Rate**: Track successful request percentage to detect network anomalies early.
* **Median Request Time**: Shows median request duration changes (e.g., p50, p75, p95) to evaluate overall network performance levels.
* **Slow Requests**: Statistics of slow request trends exceeding response time thresholds to locate performance bottlenecks.
* **Failed Requests**: Monitor occurrence of failed or error requests to quickly identify API issues.
* **Resource Request Status Distribution**:
* **Request Status Code Proportion**: Pie chart showing distribution of different HTTP status codes (e.g., 200, 404, 500) to identify abnormal request types.
* **Request Status Code Trend**: Monitor status code changes over time to detect abnormal spikes.
* **Request Method Distribution**:
* **Request Method Proportion**: Shows usage distribution of different HTTP methods (GET, POST, etc.).
* **Request Method Trend**: Analyze time-series changes of each request method.
* **Static Resources**:
* **Static Resource Call Ranking**: Lists most frequently called static resources (e.g., images, fonts, config files) to understand resource usage popularity.
* **Static Resource Response Ranking**: Identifies slowest responding static resources to optimize resource loading performance.
* **Network Call Ranking**:
* **Host Ranking**: Statistics of request count by source (Host) to identify main dependent service endpoints.
* **Resource Timing Ranking**: Lists longest-duration network requests with timing details (DNS resolution, TCP connection, SSL handshake, time to first byte, response time, etc.) for precise performance bottleneck identification.
## FAQ
Status code 0 is typically caused by:
* **Request Cancelled** - User left the page or cancelled the operation before the request completed, causing request interruption
* **Network Interruption or Timeout** - Request encountered network interruption, timeout, or other anomalies during transmission, potentially preventing normal status code return
* **Certificate Validation Failed** - HTTPS request SSL certificate validation failed, connection interrupted before establishment
* **SDK Compatibility** - In rare cases, specific system versions or devices may have compatibility issues causing incomplete data collection
* **Error Count** - Total count of raw error events, including every error occurrence record
* **Issue Count** - Count of aggregated issues. Flashduty aggregates similar errors into the same Issue based on error stack, error type, occurrence location, and other information
**Example:**
```
Total Errors: 100
Issue Count: 5
```
This means 100 errors were aggregated into 5 different Issues, each potentially caused by different root causes.
Benefits of aggregation:
* Easier root cause identification: Errors with the same root cause are grouped into one Issue, avoiding duplicate handling
* Priority ranking: Identify issues most needing fixes through impact scope (error count, session count)
* Track fix effectiveness: After fixing an Issue, observe whether all errors under that Issue disappear
Learn more about [Error Grouping](/en/rum/error-tracking/error-aggregation).
Use "Page Crash Ranking" and "Top Issues" to quickly locate the most impactful crash issues.
Click on specific Issues to view detailed error stacks and user environment information for precise problem code location.
Use "System Version Crash Distribution" to identify compatibility issues with specific system versions.
Use "Version Crash Distribution" to evaluate new version quality and perform hotfixes or rollbacks when necessary.
Use try-catch and global exception handlers appropriately to prevent uncaught exceptions from causing crashes.
Percentiles are important statistical indicators for measuring data distribution:
| Percentile | Meaning |
| ---------------- | ------------------------------------------------------------------- |
| **P50 (Median)** | 50% of users have better experience than this value, 50% have worse |
| **P75** | 75% of users have better experience than this value, 25% have worse |
| **P90** | 90% of users have better experience than this value, 10% have worse |
| **P95** | 95% of users have better experience than this value, 5% have worse |
**Why use P75 instead of average?**
* Averages are easily skewed by extreme values and may not represent most users' real experience
* P75 better reflects the experience of most users and is an industry-standard performance evaluation metric
* Google recommends using P75 as a core performance metric
**Example:**
```
App Startup Time P75 = 1.7s
→ 75% of users have startup time within 1.7s, 25% exceed 1.7s
Memory Usage P75 = 233MB
→ 75% of scenarios have memory usage within 233MB
```
These are important metrics for measuring app smoothness:
| Metric Type | Threshold | User Experience Impact | Priority |
| ---------------- | -------------------------------------- | ---------------------------------------- | ----------------------------------------------------- |
| **Slow Frame** | Render time > 16.67ms (60fps standard) | Minor jank | Occasional is acceptable, frequent needs optimization |
| **Frozen Frame** | Render time > 700ms | Complete UI freeze, user cannot interact | Severely impacts experience, must fix |
| **Long Task** | Main thread execution > 100ms | Blocks user interaction and UI updates | Needs optimization |
**Common causes of long tasks:**
* Complex calculations
* Large data processing
* Synchronous I/O operations
**Optimization suggestions:**
* Move time-consuming operations to background threads
* Process large amounts of data in batches
* Optimize algorithm complexity
* Avoid synchronous network requests or disk I/O on the main thread
Use "Page Loading Time Ranking" to identify the slowest loading pages and prioritize optimization.
* Use pagination or virtual list techniques to avoid loading large amounts of data at once
* Use data preloading and caching strategies to reduce wait times
* Optimize network requests and merge API calls
* Reduce view hierarchy nesting to lower layout calculation complexity
* Avoid overuse of transparent views and rounded corner effects
* Lazy load non-first-screen content
* Use appropriate image formats and sizes
* Use progressive loading or placeholder images
* Compress and cache images
Move complex view rendering operations to background threads.
**ANR (Application Not Responding)** is Android's app unresponsive mechanism:
* When the app's main thread is blocked for more than 5 seconds, the system displays an "App Not Responding" dialog
* Users can choose "Wait" or "Close App"
* ANR severely impacts user experience and may lead to app uninstallation
Common ANR causes:
* **Main thread executing time-consuming operations**: Synchronous network requests, large file I/O, complex calculations, database operations
* **Main thread waiting for locks**: Multi-thread deadlocks, waiting for other threads to release locks
* **Insufficient system resources**: CPU occupied by other apps, insufficient memory causing frequent GC
**Methods to reduce ANR rate:**
1. **Avoid main thread blocking** - Move time-consuming operations to background threads (using AsyncTask, Coroutines, RxJava, etc.)
2. **Optimize lock usage** - Reduce lock hold time, avoid nested locks, use lock-free data structures
3. **Optimize lifecycle methods** - onCreate/onResume and other methods should return quickly
4. **Monitor and analyze** - Use StrictMode to detect main thread violations, use RUM dashboard to locate issues
Use "Long Task Monitoring" and "Freeze Duration Distribution" to identify specific code causing freezes.
Move time-consuming operations (network requests, database I/O, complex calculations, large file I/O) to background threads.
* Reduce view hierarchy to lower layout complexity
* Avoid complex view calculations on the main thread
* Use RecyclerView (Android) or UITableView/UICollectionView (iOS) optimization techniques
* Use hardware acceleration appropriately
* Implement view recycling mechanisms
* Optimize item layout complexity
* Avoid time-consuming operations during item binding
Combine performance Insights dashboard with system tools (Android Profiler, Xcode Instruments) to locate specific freeze code.
Set reasonable freeze detection thresholds based on business characteristics and user expectations (recommended 200-500ms).
**Logged-in User Identification**
For apps requiring user login (e.g., e-commerce, social, finance), you can call the SDK's user identification method after user login:
* Android: See [Android User Session Configuration](/en/rum/sdk/android/advanced-config#user-sessions)
* iOS: See [iOS User Session Configuration](/en/rum/sdk/ios/advanced-config#user-sessions)
**Device Fingerprint Identification**
For apps without login state, we recommend generating stable device fingerprints based on device information and reporting them as user identifiers:
| Platform | Available Identifiers |
| ----------- | ---------------------------------------------------------------- |
| **Android** | Android ID, IMEI (requires permission), Advertising ID |
| **iOS** | IDFV (Identifier for Vendor), IDFA (requires user authorization) |
Use "Resource Timing Ranking" to locate APIs with the longest response times.
Review DNS resolution, TCP connection, SSL handshake, time to first byte, and other phase durations to precisely locate bottlenecks.
| Optimization Area | Specific Measures |
| --------------------------- | ------------------------------------------------------------------ |
| **DNS Optimization** | Use DNS caching, HTTPDNS |
| **Connection Optimization** | Enable HTTP/2, connection reuse, reduce redirects |
| **Transfer Optimization** | Enable GZIP compression, optimize data format, reduce request size |
| **API Optimization** | Optimize backend API performance, use CDN for static resources |
* Review "App Startup Time (P75)" metric to understand most users' startup experience
* Use "Startup Time Trend Chart" to evaluate optimization effectiveness and detect performance regressions
* Review "Sample Distribution Histogram" to identify long-tail issues
Delay non-essential initialization operations until after first screen rendering to reduce startup time.
Reduce third-party SDKs and libraries loaded during startup, adopt lazy loading strategies.
Reduce home page view hierarchy complexity to decrease first render time.
* **Android**: Use App Startup Library to manage component initialization order
* **iOS**: Use Lazy Initialization to delay initialization of non-critical components
Flashduty RUM typically completes data collection and display within **1-3 minutes** after data generation. Under good network conditions, most data can achieve near real-time updates.
## Metrics Reference
### Overview Metrics
| Metric | Collection Field | Description |
| -------------------- | ---------------- | ------------------------------------------------ |
| UV | usr\_id | Total deduplicated users |
| Session Count | session\_id | Total sessions when app is opened and used |
| Avg Session Duration | - | Total session duration divided by total sessions |
| Session Frequency | - | Total sessions divided by active users |
### Performance Metric Thresholds
| Metric | Collection Field | Good | Moderate | Poor |
| ---------------- | ----------------------------- | ---------------- | ---------------- | ------------------- |
| App Startup Time | view\_app\_start\_time | Within 2s | Within 4s | Over 4s |
| Frame Rate | view\_refresh\_rate\_average | 55 FPS or above | 50 FPS or above | Below 50 FPS |
| CPU Usage | view\_cpu\_ticks\_per\_second | Below 40 ticks/s | Below 60 ticks/s | 60 ticks/s or above |
| Memory Usage | view\_memory\_average | Below 100 MB | Below 200 MB | 200 MB or above |
| Peak Memory | view\_memory\_max | Below 200 MB | Below 400 MB | 400 MB or above |
### Smoothness Metrics
| Metric | Definition | Collection Field |
| ---------------- | ------------------------------------ | -------------------- |
| Slow Frames | Frames with render time over 16ms | - |
| Frozen Frames | Frames with render time over 700ms | - |
| Long Tasks | Tasks with execution time over 100ms | long\_task\_duration |
| Freeze Frequency | Average freezes per second | - |
### Stability Metrics
| Metric | Calculation | Description |
| --------------- | ----------------------------------------- | --------------------------------------------------------- |
| Crash Count | Direct count | Total crashes caused by unhandled exceptions or signals |
| Crash-free Rate | 1 minus crash session ratio | Recommended to maintain above 99% |
| ANR Rate | ANR sessions divided by total sessions | Triggered when UI thread blocked over 5 seconds (Android) |
| App Freeze Rate | Freeze sessions divided by total sessions | Counted when main thread unresponsive over 250ms (iOS) |
## Further Reading
### SDK Integration and Configuration
Learn how to integrate RUM SDK in Android apps
Learn how to integrate RUM SDK in iOS apps
Configure advanced Android RUM SDK features
Configure advanced iOS RUM SDK features
Learn about data types collected by Android RUM SDK
Learn about data types collected by iOS RUM SDK
### Data Analysis and Monitoring
Learn how to use RUM Explorer for in-depth data analysis
Master error tracking and debugging techniques
Understand error grouping mechanisms
The Resource Analysis module helps you gain deep insights into your app's network request performance and identify optimization opportunities:
* **Request Count**: Monitor network request volume trends to understand app network activity.
* **Request Success Rate**: Track successful request percentage to detect network anomalies early.
* **Median Request Time**: Shows median request duration changes (e.g., p50, p75, p95) to evaluate overall network performance levels.
* **Slow Requests**: Statistics of slow request trends exceeding response time thresholds to locate performance bottlenecks.
* **Failed Requests**: Monitor occurrence of failed or error requests to quickly identify API issues.
* **Resource Request Status Distribution**:
* **Request Status Code Proportion**: Pie chart showing distribution of different HTTP status codes (e.g., 200, 404, 500) to identify abnormal request types.
* **Request Status Code Trend**: Monitor status code changes over time to detect abnormal spikes.
* **Request Method Distribution**:
* **Request Method Proportion**: Shows usage distribution of different HTTP methods (GET, POST, etc.).
* **Request Method Trend**: Analyze time-series changes of each request method.
* **Static Resources**:
* **Static Resource Call Ranking**: Lists most frequently called static resources (e.g., images, fonts, config files) to understand resource usage popularity.
* **Static Resource Response Ranking**: Identifies slowest responding static resources to optimize resource loading performance.
* **Network Call Ranking**:
* **Host Ranking**: Statistics of request count by source (Host) to identify main dependent service endpoints.
* **Resource Timing Ranking**: Lists longest-duration network requests with timing details (DNS resolution, TCP connection, SSL handshake, time to first byte, response time, etc.) for precise performance bottleneck identification.
## FAQ
Status code 0 is typically caused by:
* **Request Cancelled** - User left the page or cancelled the operation before the request completed, causing request interruption
* **Network Interruption or Timeout** - Request encountered network interruption, timeout, or other anomalies during transmission, potentially preventing normal status code return
* **Certificate Validation Failed** - HTTPS request SSL certificate validation failed, connection interrupted before establishment
* **SDK Compatibility** - In rare cases, specific system versions or devices may have compatibility issues causing incomplete data collection
* **Error Count** - Total count of raw error events, including every error occurrence record
* **Issue Count** - Count of aggregated issues. Flashduty aggregates similar errors into the same Issue based on error stack, error type, occurrence location, and other information
**Example:**
```
Total Errors: 100
Issue Count: 5
```
This means 100 errors were aggregated into 5 different Issues, each potentially caused by different root causes.
Benefits of aggregation:
* Easier root cause identification: Errors with the same root cause are grouped into one Issue, avoiding duplicate handling
* Priority ranking: Identify issues most needing fixes through impact scope (error count, session count)
* Track fix effectiveness: After fixing an Issue, observe whether all errors under that Issue disappear
Learn more about [Error Grouping](/en/rum/error-tracking/error-aggregation).
Use "Page Crash Ranking" and "Top Issues" to quickly locate the most impactful crash issues.
Click on specific Issues to view detailed error stacks and user environment information for precise problem code location.
Use "System Version Crash Distribution" to identify compatibility issues with specific system versions.
Use "Version Crash Distribution" to evaluate new version quality and perform hotfixes or rollbacks when necessary.
Use try-catch and global exception handlers appropriately to prevent uncaught exceptions from causing crashes.
Percentiles are important statistical indicators for measuring data distribution:
| Percentile | Meaning |
| ---------------- | ------------------------------------------------------------------- |
| **P50 (Median)** | 50% of users have better experience than this value, 50% have worse |
| **P75** | 75% of users have better experience than this value, 25% have worse |
| **P90** | 90% of users have better experience than this value, 10% have worse |
| **P95** | 95% of users have better experience than this value, 5% have worse |
**Why use P75 instead of average?**
* Averages are easily skewed by extreme values and may not represent most users' real experience
* P75 better reflects the experience of most users and is an industry-standard performance evaluation metric
* Google recommends using P75 as a core performance metric
**Example:**
```
App Startup Time P75 = 1.7s
→ 75% of users have startup time within 1.7s, 25% exceed 1.7s
Memory Usage P75 = 233MB
→ 75% of scenarios have memory usage within 233MB
```
These are important metrics for measuring app smoothness:
| Metric Type | Threshold | User Experience Impact | Priority |
| ---------------- | -------------------------------------- | ---------------------------------------- | ----------------------------------------------------- |
| **Slow Frame** | Render time > 16.67ms (60fps standard) | Minor jank | Occasional is acceptable, frequent needs optimization |
| **Frozen Frame** | Render time > 700ms | Complete UI freeze, user cannot interact | Severely impacts experience, must fix |
| **Long Task** | Main thread execution > 100ms | Blocks user interaction and UI updates | Needs optimization |
**Common causes of long tasks:**
* Complex calculations
* Large data processing
* Synchronous I/O operations
**Optimization suggestions:**
* Move time-consuming operations to background threads
* Process large amounts of data in batches
* Optimize algorithm complexity
* Avoid synchronous network requests or disk I/O on the main thread
Use "Page Loading Time Ranking" to identify the slowest loading pages and prioritize optimization.
* Use pagination or virtual list techniques to avoid loading large amounts of data at once
* Use data preloading and caching strategies to reduce wait times
* Optimize network requests and merge API calls
* Reduce view hierarchy nesting to lower layout calculation complexity
* Avoid overuse of transparent views and rounded corner effects
* Lazy load non-first-screen content
* Use appropriate image formats and sizes
* Use progressive loading or placeholder images
* Compress and cache images
Move complex view rendering operations to background threads.
**ANR (Application Not Responding)** is Android's app unresponsive mechanism:
* When the app's main thread is blocked for more than 5 seconds, the system displays an "App Not Responding" dialog
* Users can choose "Wait" or "Close App"
* ANR severely impacts user experience and may lead to app uninstallation
Common ANR causes:
* **Main thread executing time-consuming operations**: Synchronous network requests, large file I/O, complex calculations, database operations
* **Main thread waiting for locks**: Multi-thread deadlocks, waiting for other threads to release locks
* **Insufficient system resources**: CPU occupied by other apps, insufficient memory causing frequent GC
**Methods to reduce ANR rate:**
1. **Avoid main thread blocking** - Move time-consuming operations to background threads (using AsyncTask, Coroutines, RxJava, etc.)
2. **Optimize lock usage** - Reduce lock hold time, avoid nested locks, use lock-free data structures
3. **Optimize lifecycle methods** - onCreate/onResume and other methods should return quickly
4. **Monitor and analyze** - Use StrictMode to detect main thread violations, use RUM dashboard to locate issues
Use "Long Task Monitoring" and "Freeze Duration Distribution" to identify specific code causing freezes.
Move time-consuming operations (network requests, database I/O, complex calculations, large file I/O) to background threads.
* Reduce view hierarchy to lower layout complexity
* Avoid complex view calculations on the main thread
* Use RecyclerView (Android) or UITableView/UICollectionView (iOS) optimization techniques
* Use hardware acceleration appropriately
* Implement view recycling mechanisms
* Optimize item layout complexity
* Avoid time-consuming operations during item binding
Combine performance Insights dashboard with system tools (Android Profiler, Xcode Instruments) to locate specific freeze code.
Set reasonable freeze detection thresholds based on business characteristics and user expectations (recommended 200-500ms).
**Logged-in User Identification**
For apps requiring user login (e.g., e-commerce, social, finance), you can call the SDK's user identification method after user login:
* Android: See [Android User Session Configuration](/en/rum/sdk/android/advanced-config#user-sessions)
* iOS: See [iOS User Session Configuration](/en/rum/sdk/ios/advanced-config#user-sessions)
**Device Fingerprint Identification**
For apps without login state, we recommend generating stable device fingerprints based on device information and reporting them as user identifiers:
| Platform | Available Identifiers |
| ----------- | ---------------------------------------------------------------- |
| **Android** | Android ID, IMEI (requires permission), Advertising ID |
| **iOS** | IDFV (Identifier for Vendor), IDFA (requires user authorization) |
Use "Resource Timing Ranking" to locate APIs with the longest response times.
Review DNS resolution, TCP connection, SSL handshake, time to first byte, and other phase durations to precisely locate bottlenecks.
| Optimization Area | Specific Measures |
| --------------------------- | ------------------------------------------------------------------ |
| **DNS Optimization** | Use DNS caching, HTTPDNS |
| **Connection Optimization** | Enable HTTP/2, connection reuse, reduce redirects |
| **Transfer Optimization** | Enable GZIP compression, optimize data format, reduce request size |
| **API Optimization** | Optimize backend API performance, use CDN for static resources |
* Review "App Startup Time (P75)" metric to understand most users' startup experience
* Use "Startup Time Trend Chart" to evaluate optimization effectiveness and detect performance regressions
* Review "Sample Distribution Histogram" to identify long-tail issues
Delay non-essential initialization operations until after first screen rendering to reduce startup time.
Reduce third-party SDKs and libraries loaded during startup, adopt lazy loading strategies.
Reduce home page view hierarchy complexity to decrease first render time.
* **Android**: Use App Startup Library to manage component initialization order
* **iOS**: Use Lazy Initialization to delay initialization of non-critical components
Flashduty RUM typically completes data collection and display within **1-3 minutes** after data generation. Under good network conditions, most data can achieve near real-time updates.
## Metrics Reference
### Overview Metrics
| Metric | Collection Field | Description |
| -------------------- | ---------------- | ------------------------------------------------ |
| UV | usr\_id | Total deduplicated users |
| Session Count | session\_id | Total sessions when app is opened and used |
| Avg Session Duration | - | Total session duration divided by total sessions |
| Session Frequency | - | Total sessions divided by active users |
### Performance Metric Thresholds
| Metric | Collection Field | Good | Moderate | Poor |
| ---------------- | ----------------------------- | ---------------- | ---------------- | ------------------- |
| App Startup Time | view\_app\_start\_time | Within 2s | Within 4s | Over 4s |
| Frame Rate | view\_refresh\_rate\_average | 55 FPS or above | 50 FPS or above | Below 50 FPS |
| CPU Usage | view\_cpu\_ticks\_per\_second | Below 40 ticks/s | Below 60 ticks/s | 60 ticks/s or above |
| Memory Usage | view\_memory\_average | Below 100 MB | Below 200 MB | 200 MB or above |
| Peak Memory | view\_memory\_max | Below 200 MB | Below 400 MB | 400 MB or above |
### Smoothness Metrics
| Metric | Definition | Collection Field |
| ---------------- | ------------------------------------ | -------------------- |
| Slow Frames | Frames with render time over 16ms | - |
| Frozen Frames | Frames with render time over 700ms | - |
| Long Tasks | Tasks with execution time over 100ms | long\_task\_duration |
| Freeze Frequency | Average freezes per second | - |
### Stability Metrics
| Metric | Calculation | Description |
| --------------- | ----------------------------------------- | --------------------------------------------------------- |
| Crash Count | Direct count | Total crashes caused by unhandled exceptions or signals |
| Crash-free Rate | 1 minus crash session ratio | Recommended to maintain above 99% |
| ANR Rate | ANR sessions divided by total sessions | Triggered when UI thread blocked over 5 seconds (Android) |
| App Freeze Rate | Freeze sessions divided by total sessions | Counted when main thread unresponsive over 250ms (iOS) |
## Further Reading
### SDK Integration and Configuration
Learn how to integrate RUM SDK in Android apps
Learn how to integrate RUM SDK in iOS apps
Configure advanced Android RUM SDK features
Configure advanced iOS RUM SDK features
Learn about data types collected by Android RUM SDK
Learn about data types collected by iOS RUM SDK
### Data Analysis and Monitoring
Learn how to use RUM Explorer for in-depth data analysis
Master error tracking and debugging techniques
Understand error grouping mechanisms