> ## Documentation Index
> Fetch the complete documentation index at: https://docs.flashduty.com/llms.txt
> Use this file to discover all available pages before exploring further.
# Feature Overview
> Master the powerful features of Flashduty RUM Explorer to deeply analyze user data, performance metrics, and application behavior through a visual interface.
Flashduty RUM **Explorer** is a powerful data analysis tool designed to help developers deeply inspect data collected from applications and obtain detailed information about RUM events. Through an intuitive visual interface, you can gain a comprehensive understanding of user behavior, application performance, and system health.
## Core Features
Browse and analyze complete user session paths to understand user behavior patterns within the application
Deeply analyze performance issues affecting page views, resource loading, or user operations
Quickly locate and diagnose application errors and long-running tasks
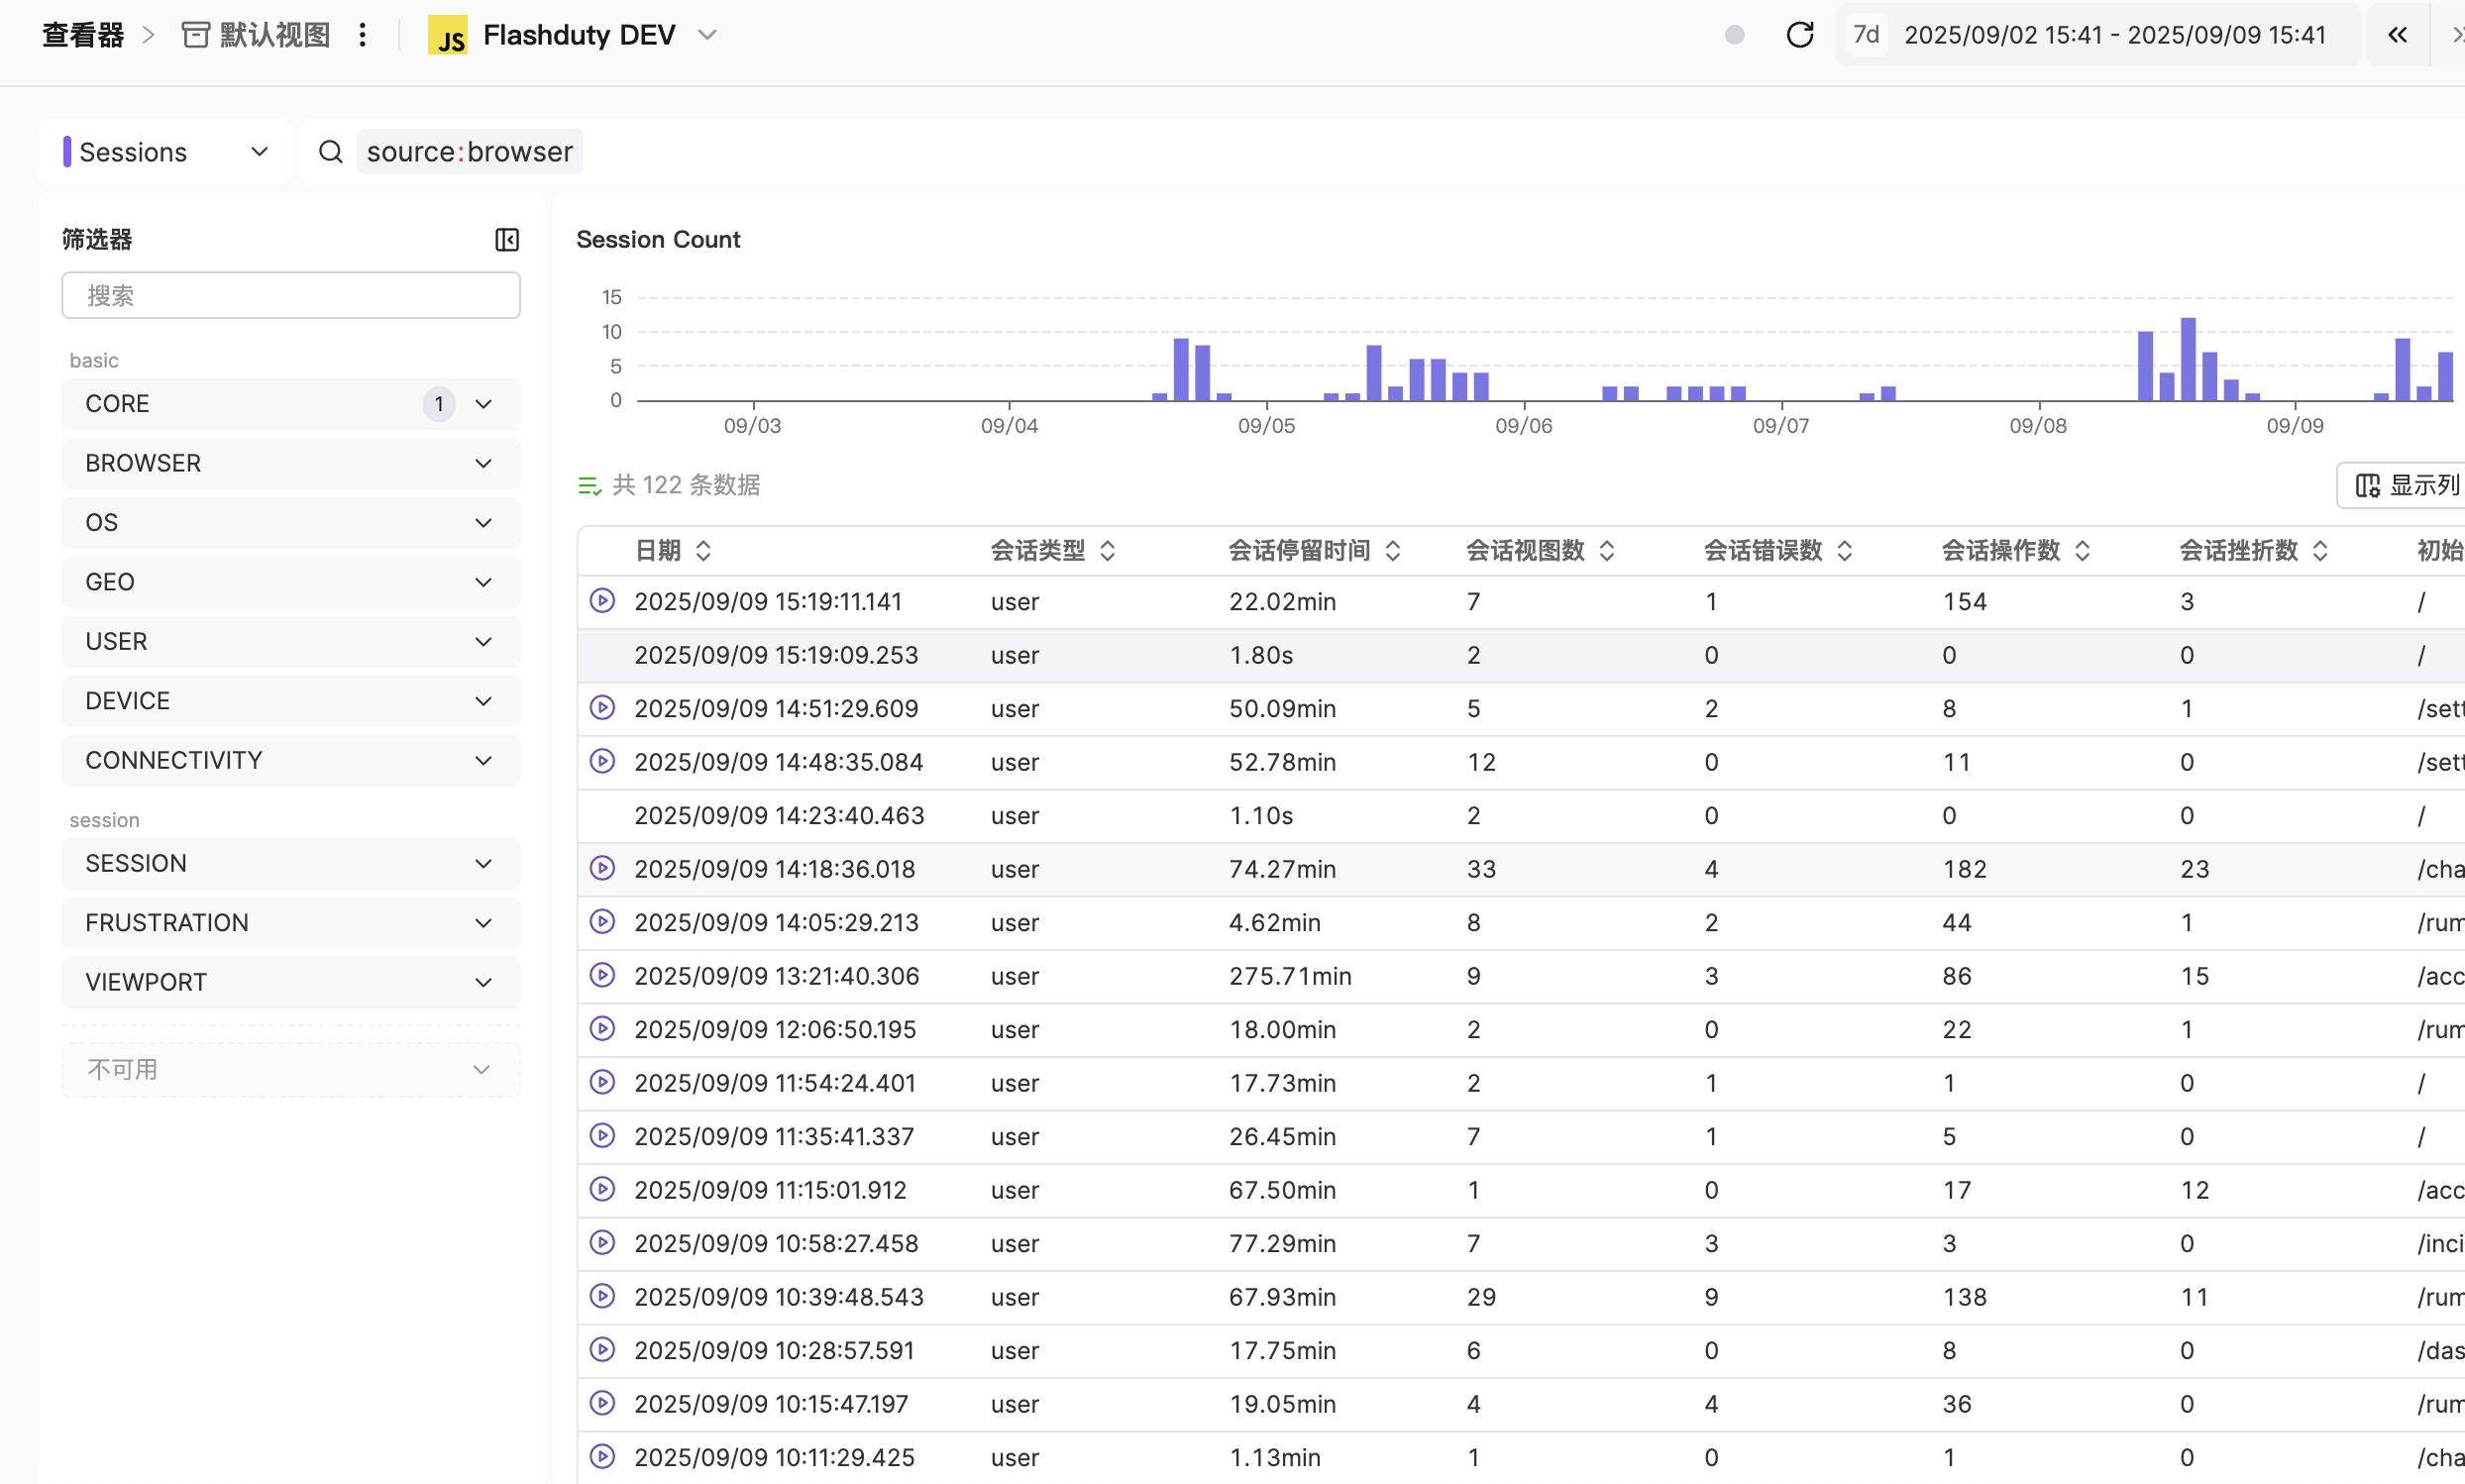
Precisely filter and select RUM events through the search bar and visualization type selection
## Value and Benefits
| Benefit | Description |
| ------------------------------------- | ---------------------------------------------------------------------------------------------------------- |
| **Data-Driven Decisions** | Make product optimization and performance improvement decisions based on real user data |
| **Quick Problem Location** | Quickly identify performance bottlenecks and user experience issues through visual interface |
| **User Behavior Insights** | Gain deep understanding of how users interact with your application and discover improvement opportunities |
| **Comprehensive Monitoring Coverage** | Full-chain monitoring and analysis from page load to user operations |
## Use Cases
Analyze page load times and resource loading efficiency to identify performance bottlenecks.
Understand user operation paths and discover issues in interaction design.
Quickly locate the specific scenarios and context where application errors occur.
Analyze user behavior patterns to provide data support for product feature optimization.
## Main Features Explained
Use the application selector in the top navigation bar to select a specific application and view all its RUM data.
Through the application selector, you can quickly switch between data views for different applications, focusing on performance and user behavior analysis for specific applications.
In the RUM Explorer, you can search and filter RUM events by entering query conditions in the search bar and selecting visualization types.
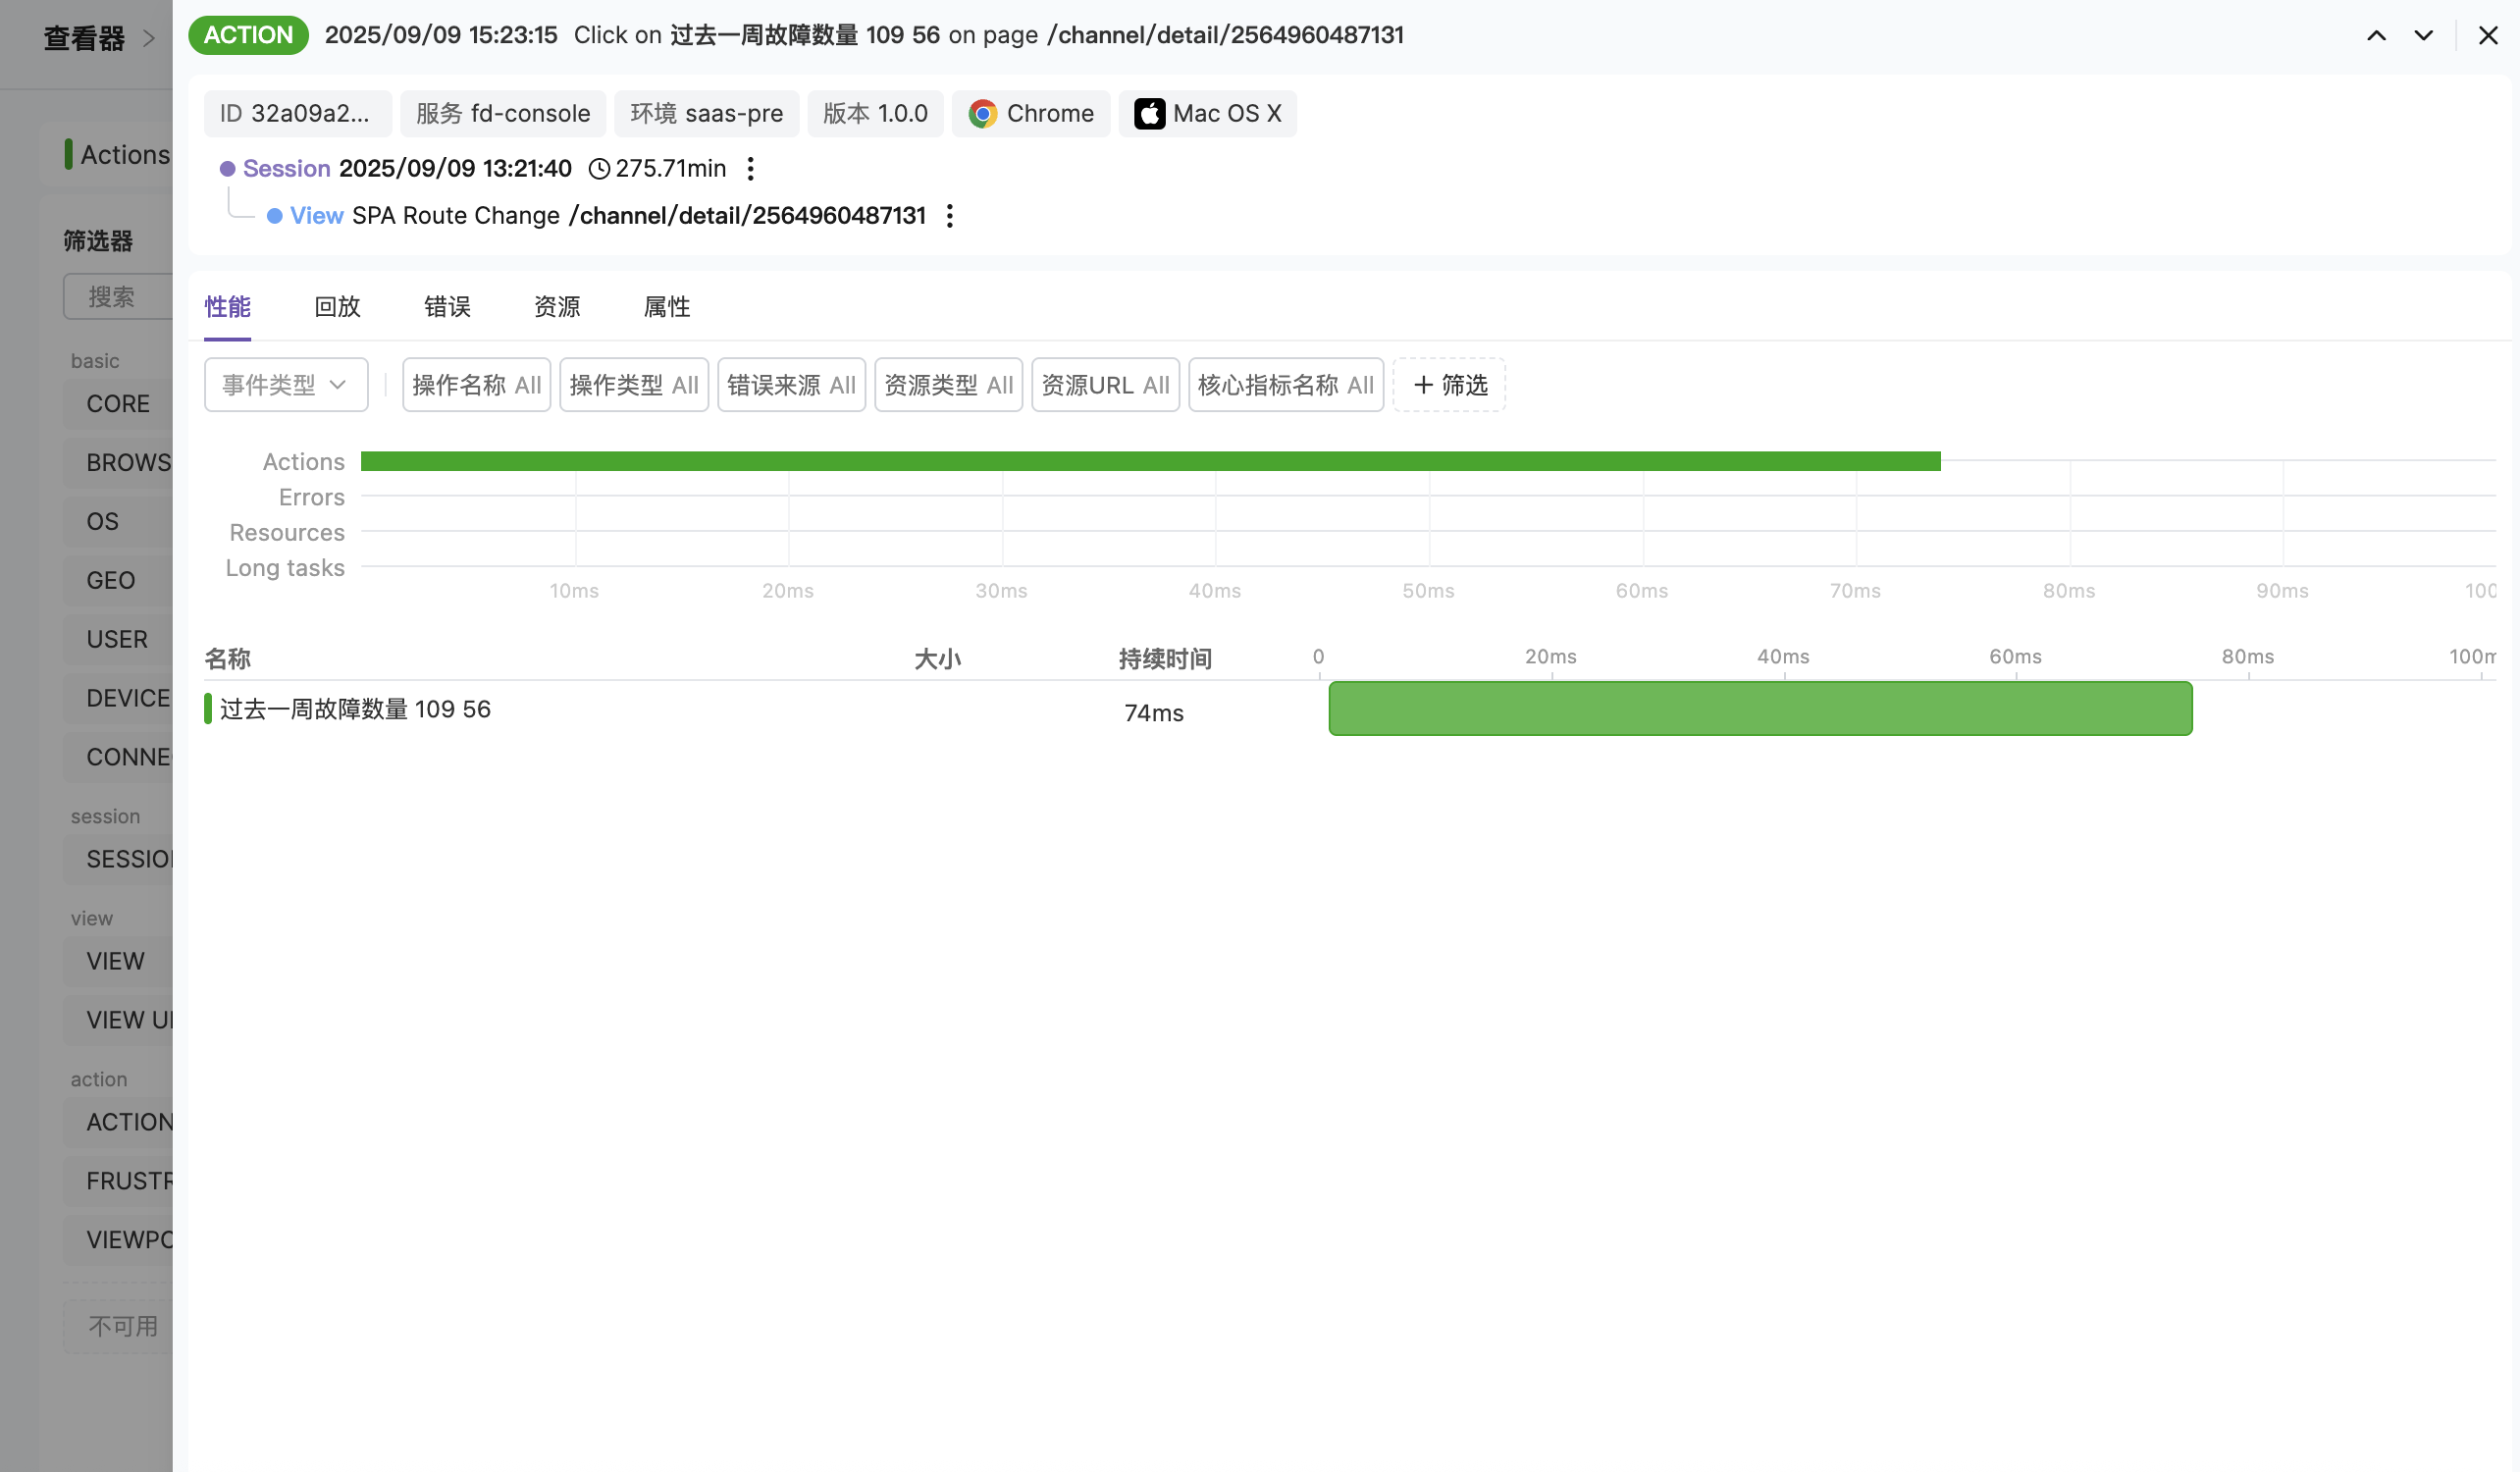
 Click on data items to view details. RUM events can be displayed from various perspectives to help you discover key information.
* View data relationships, drill down into data, or view parent node details
* View resource traces and correlate with existing monitoring system traces
Click on data items to view details. RUM events can be displayed from various perspectives to help you discover key information.
* View data relationships, drill down into data, or view parent node details
* View resource traces and correlate with existing monitoring system traces
 ## Platform-Aware View Metrics
When you open the detail panel for a View, the metric cards on the **Performance** tab adapt to the View's platform, so you always see the metrics that platform actually exposes.
| Platform | Performance Metric Cards |
| -------------------------- | --------------------------------------------------------------------- |
| **Browser (Web)** | `LCP`, `FCP`, `INP`, `CLS` |
| **Native (Android / iOS)** | `refresh_rate`, `cpu_ticks`, `memory` |
| **WeChat Mini Program** | `first_render`, `lcp`, `fcp`, `onload_to_onshow`, `onshow_to_onready` |
The platform is determined by the View event's own `source` field — no manual switching needed. For Mini Programs, `onload_to_onshow` and `onshow_to_onready` cover the two segments of the page lifecycle and help diagnose slow cold starts.
The EventTable column picker also supports the following Mini Program-only fields as queryable columns: `view_first_render`, `view_onload_to_onshow`, `view_onshow_to_onready`.
## Saved Views
The saved views feature allows you to save your current query state as a reusable view for quickly switching between different analysis scenarios. Each account can create up to **20** saved views, and views are only visible to you.
### What a View Saves
Each saved view contains the following information:
| Saved Item | Description |
| ------------------- | -------------------------------------------------------------------------------- |
| **Time Range** | The currently selected time filter |
| **Query Type** | The currently selected event type (e.g., Sessions, Views, Actions, Errors, etc.) |
| **Query Statement** | The DQL filter conditions in the search bar |
| **Custom Columns** | The column configuration of the data table |
### View Operations
Click the view menu at the top of the Explorer, select "Save as New View", enter a view name, and confirm. View names must be unique.
Click the view menu and select the target view from the list. After switching, the Explorer automatically restores the saved time range, query type, query statement, and column configuration.
In the view list, click the action menu on the right side of the target view and select "Edit View" to modify the view name. If you have modified the current view's query conditions, you can also use "Save Changes" to update the view with the latest state.
Select "Delete View" from the view list or action menu and confirm. After deleting the currently active view, the Explorer automatically switches back to the default view.
In the view list, click the action menu on the right side of the target view and select "Copy Link" to get a shareable link for that view. Share the link with team members so they can open the same query view directly.
Select "Switch to Default View" from the action menu to clear all filter conditions and restore the Explorer to its initial state.
## Next Steps
Master query syntax for precise data location
Learn distributed tracing best practices
## Platform-Aware View Metrics
When you open the detail panel for a View, the metric cards on the **Performance** tab adapt to the View's platform, so you always see the metrics that platform actually exposes.
| Platform | Performance Metric Cards |
| -------------------------- | --------------------------------------------------------------------- |
| **Browser (Web)** | `LCP`, `FCP`, `INP`, `CLS` |
| **Native (Android / iOS)** | `refresh_rate`, `cpu_ticks`, `memory` |
| **WeChat Mini Program** | `first_render`, `lcp`, `fcp`, `onload_to_onshow`, `onshow_to_onready` |
The platform is determined by the View event's own `source` field — no manual switching needed. For Mini Programs, `onload_to_onshow` and `onshow_to_onready` cover the two segments of the page lifecycle and help diagnose slow cold starts.
The EventTable column picker also supports the following Mini Program-only fields as queryable columns: `view_first_render`, `view_onload_to_onshow`, `view_onshow_to_onready`.
## Saved Views
The saved views feature allows you to save your current query state as a reusable view for quickly switching between different analysis scenarios. Each account can create up to **20** saved views, and views are only visible to you.
### What a View Saves
Each saved view contains the following information:
| Saved Item | Description |
| ------------------- | -------------------------------------------------------------------------------- |
| **Time Range** | The currently selected time filter |
| **Query Type** | The currently selected event type (e.g., Sessions, Views, Actions, Errors, etc.) |
| **Query Statement** | The DQL filter conditions in the search bar |
| **Custom Columns** | The column configuration of the data table |
### View Operations
Click the view menu at the top of the Explorer, select "Save as New View", enter a view name, and confirm. View names must be unique.
Click the view menu and select the target view from the list. After switching, the Explorer automatically restores the saved time range, query type, query statement, and column configuration.
In the view list, click the action menu on the right side of the target view and select "Edit View" to modify the view name. If you have modified the current view's query conditions, you can also use "Save Changes" to update the view with the latest state.
Select "Delete View" from the view list or action menu and confirm. After deleting the currently active view, the Explorer automatically switches back to the default view.
In the view list, click the action menu on the right side of the target view and select "Copy Link" to get a shareable link for that view. Share the link with team members so they can open the same query view directly.
Select "Switch to Default View" from the action menu to clear all filter conditions and restore the Explorer to its initial state.
## Next Steps
Master query syntax for precise data location
Learn distributed tracing best practices