> ## Documentation Index
> Fetch the complete documentation index at: https://docs.flashduty.com/llms.txt
> Use this file to discover all available pages before exploring further.
# Data Analysis Guide
> Learn how to analyze and utilize performance data collected by Flashduty RUM, including performance metrics analysis, user experience assessment, and performance optimization suggestions.
The performance data analysis page helps identify the root causes of browser performance issues by analyzing real user traffic data. Use browser metrics such as Core Web Vitals and custom loading time metrics to troubleshoot slow page loading. These metrics evaluate complete page load time from the user's perspective.
## Accessing Performance Analysis
Navigate to the Performance Monitoring menu, where you can analyze performance experience from different perspectives through list or tree views.
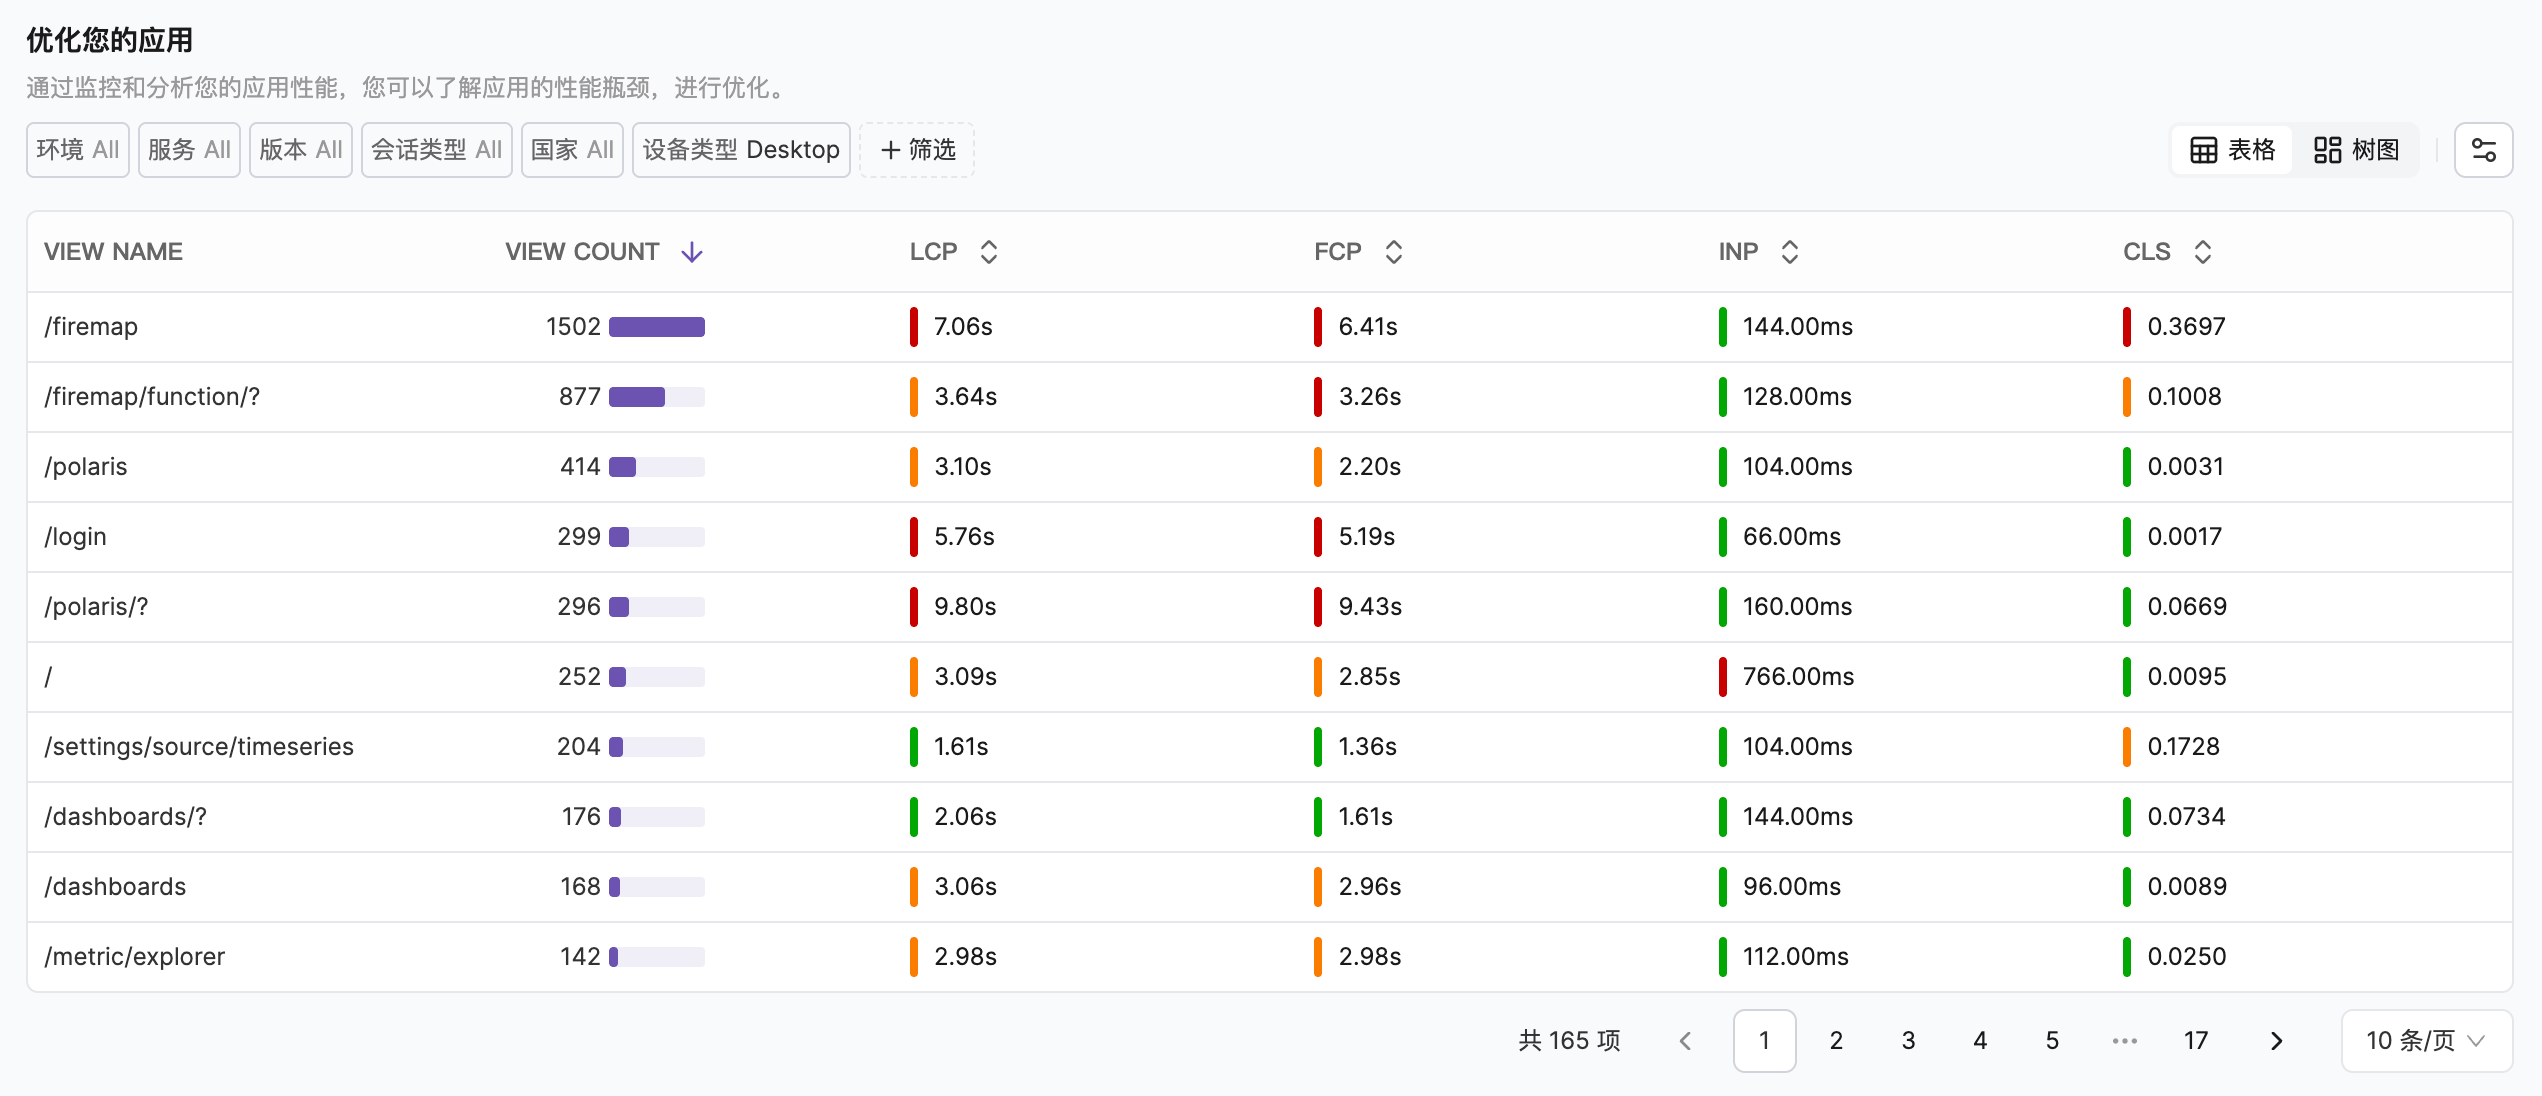
Switch to list view to see the data for each metric under Top pages sorted by page:
* Quickly view the overall metrics through the color indicators in front of the metric data to locate metrics that need improvement
* Hover over each metric to see its current level under the standard
* Click each row to view metric details for that page
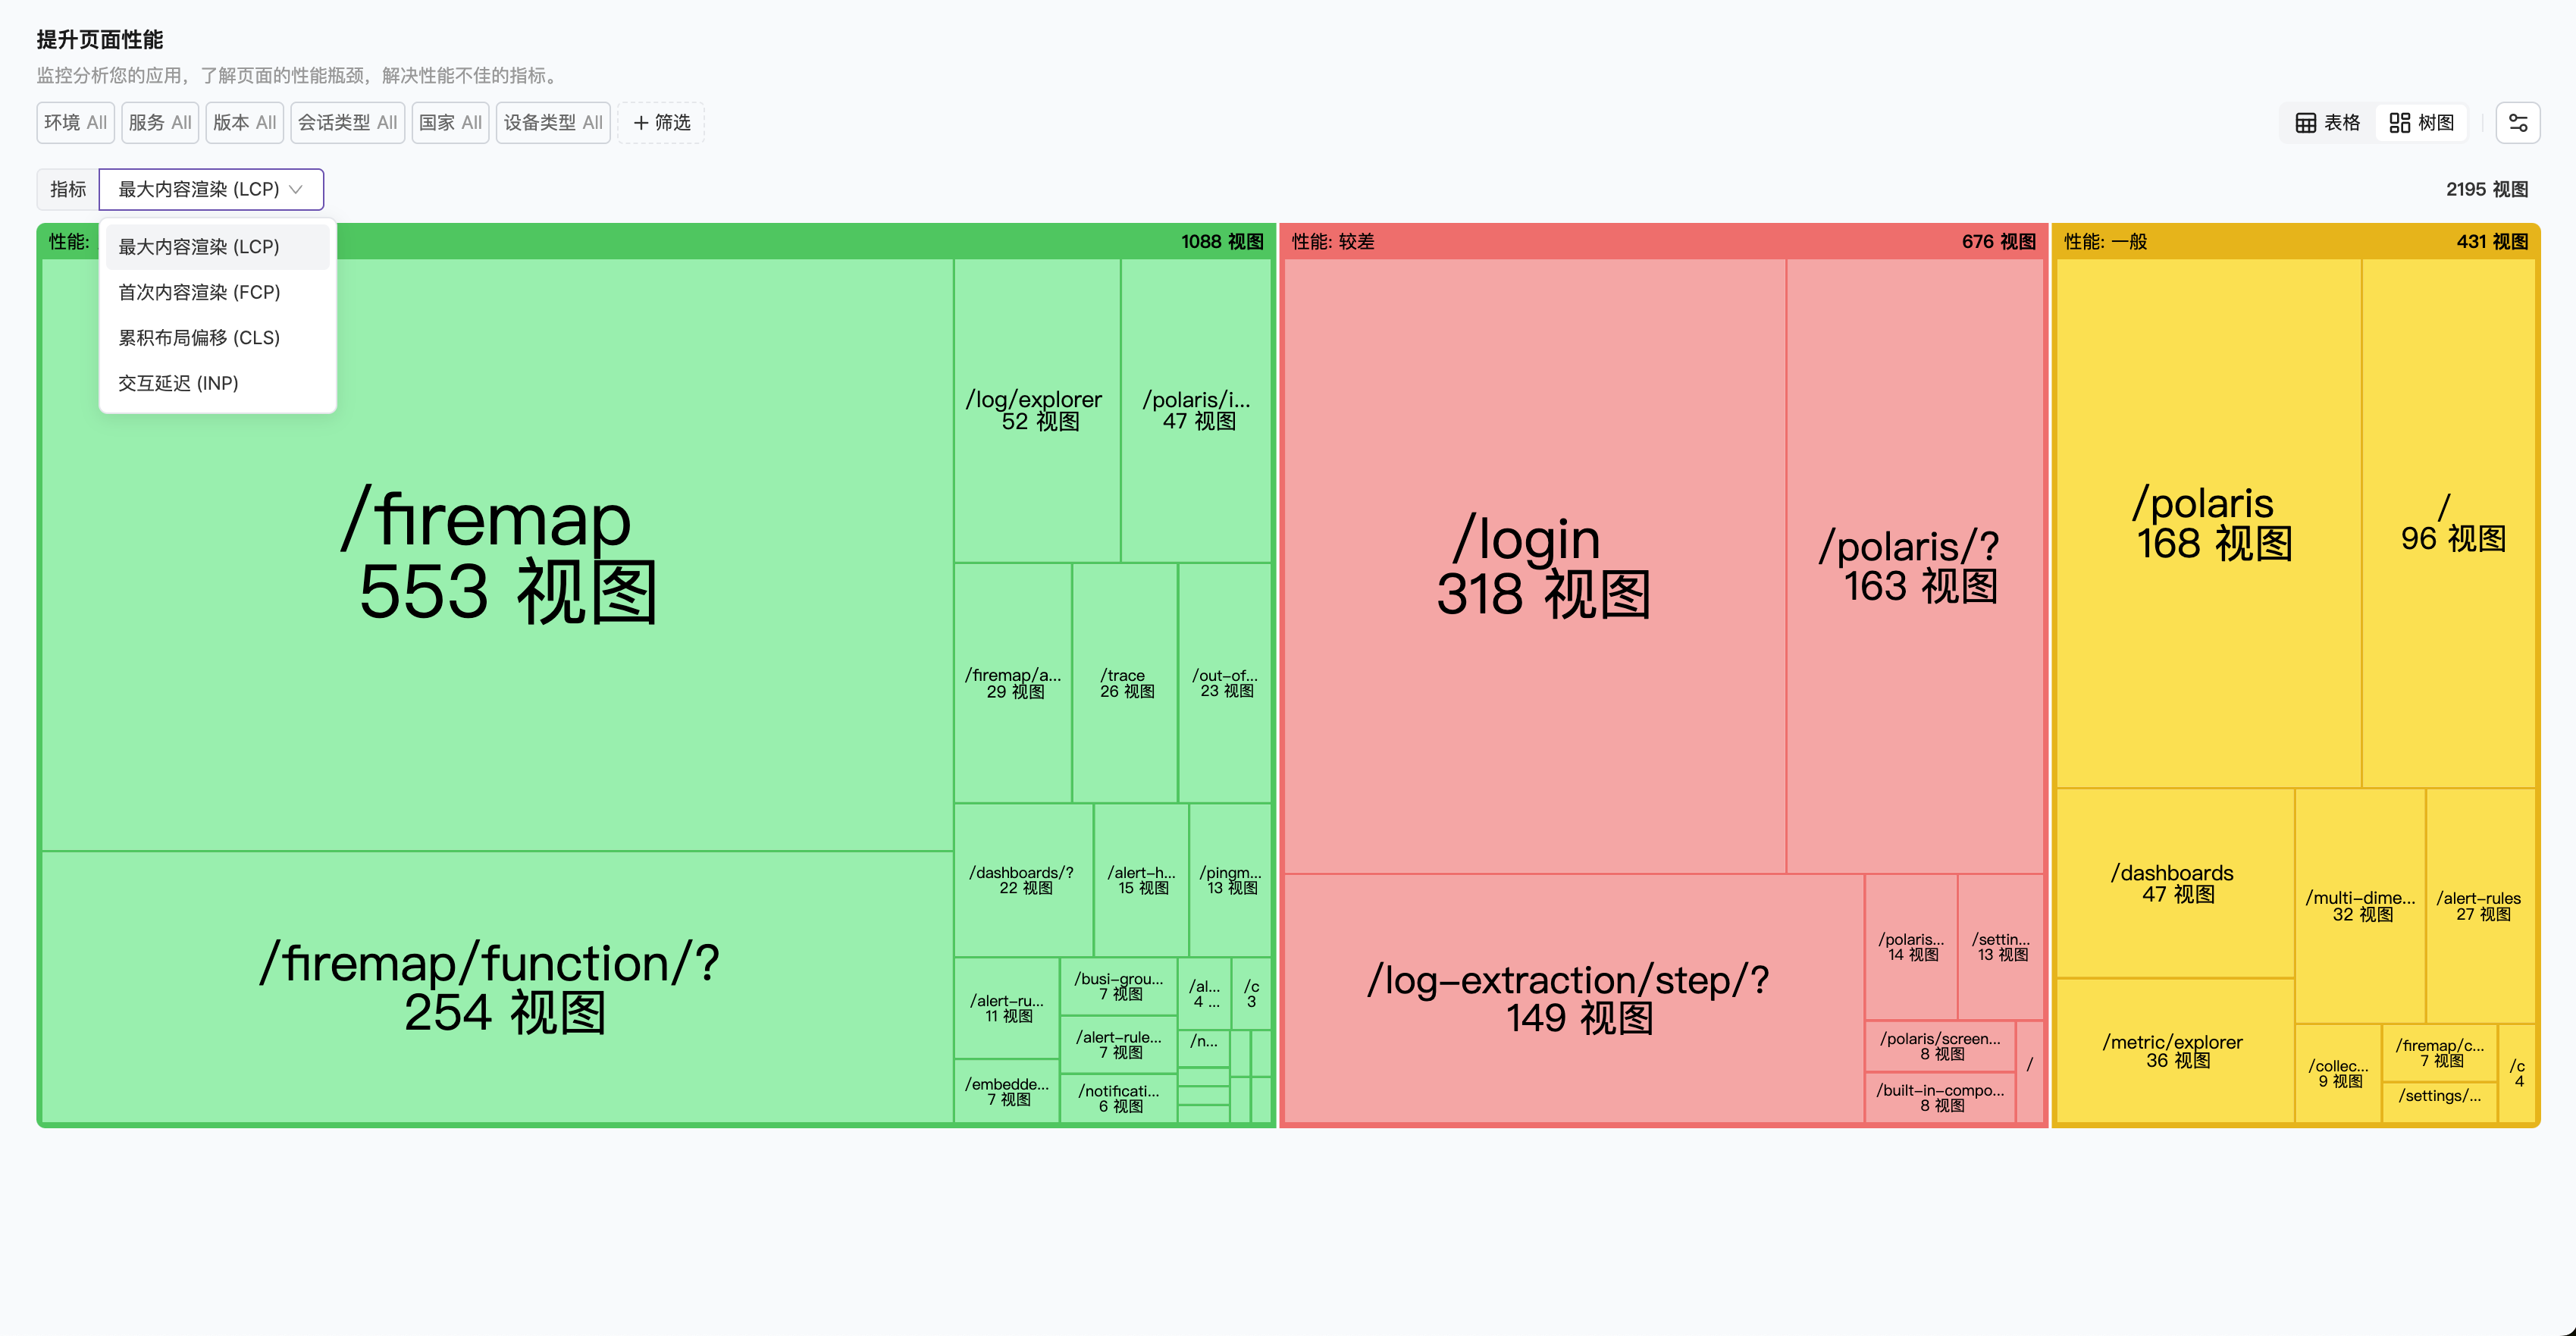
 Switch to tree view to see the list of resources to optimize from a specific metric perspective:
* Switch between different metrics to view their distribution
* View resource distribution and proportion under "Good", "Poor", and "Average" categories to quickly locate problem resources
* Click on the block representing a page to view metric details for that page, facilitating further problem diagnosis
Switch to tree view to see the list of resources to optimize from a specific metric perspective:
* Switch between different metrics to view their distribution
* View resource distribution and proportion under "Good", "Poor", and "Average" categories to quickly locate problem resources
* Click on the block representing a page to view metric details for that page, facilitating further problem diagnosis
 ## Data Analysis Dimensions
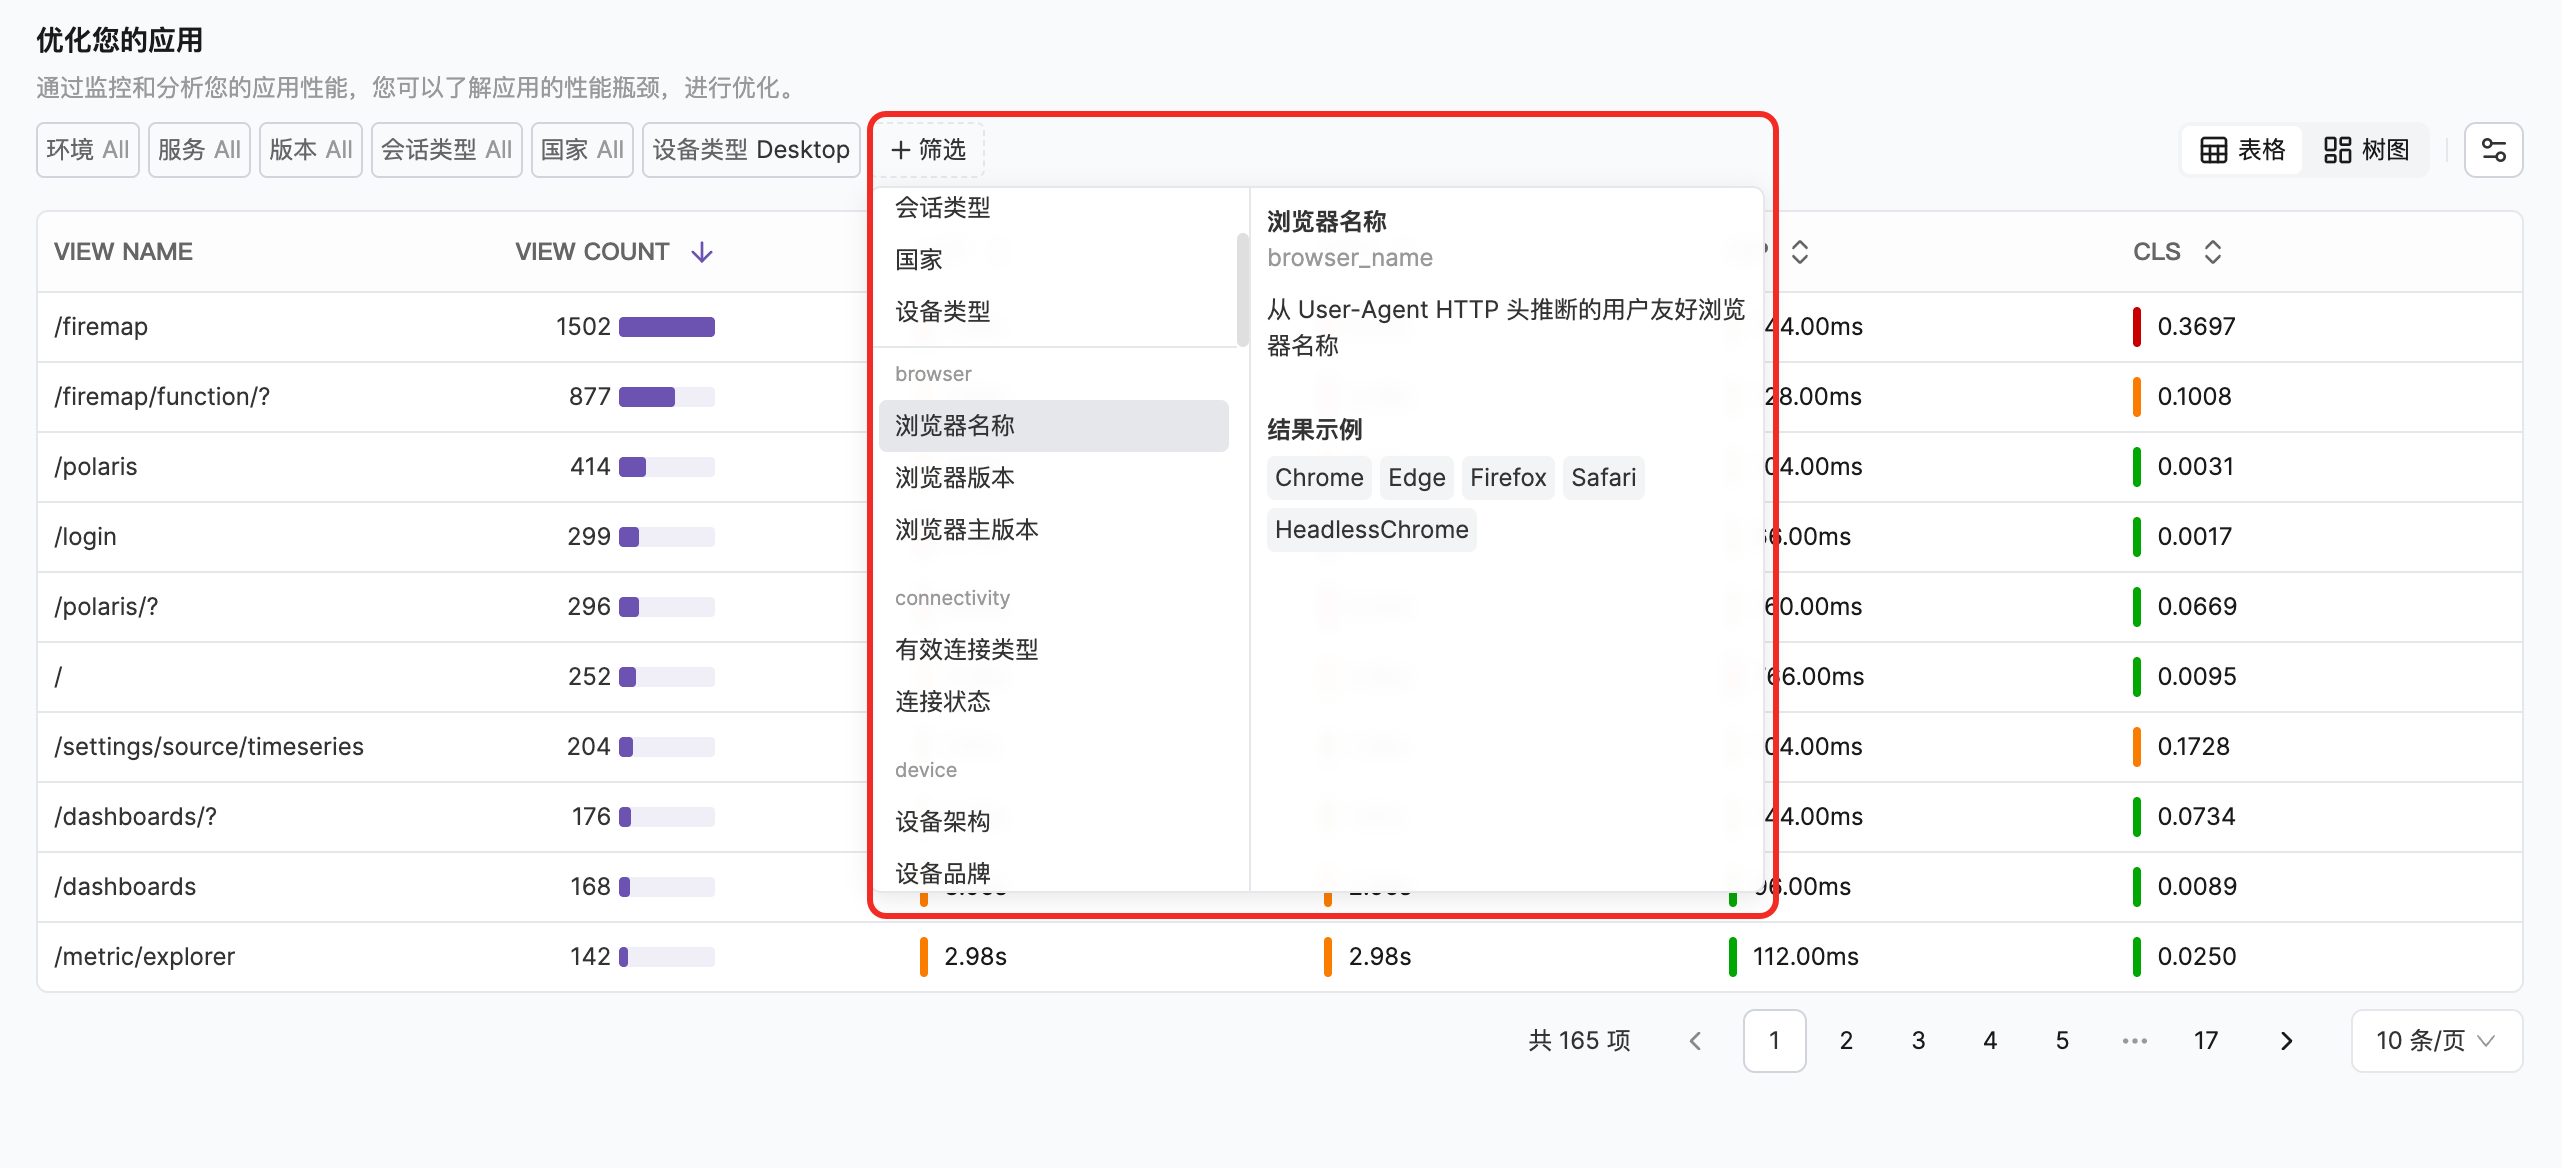
Through global filters, you can analyze page performance from different dimensions to gain insights into performance data trends:
| Dimension | Description |
| ----------------- | ----------------------------------------- |
| Browser | Filter by browser type |
| Connection Status | Filter by network connection status |
| Device | Filter by device type |
| Geolocation | Filter by geographic location information |
## Data Analysis Dimensions
Through global filters, you can analyze page performance from different dimensions to gain insights into performance data trends:
| Dimension | Description |
| ----------------- | ----------------------------------------- |
| Browser | Filter by browser type |
| Connection Status | Filter by network connection status |
| Device | Filter by device type |
| Geolocation | Filter by geographic location information |
 The performance analysis page also supports both sidebar and fullscreen viewing modes. After clicking a page record, the metric details are displayed as a sidebar by default. You can click the expand button to switch to fullscreen mode for a more complete data display and diagnostic workspace.
## Next Steps
Learn problem diagnosis and optimization methods
The performance analysis page also supports both sidebar and fullscreen viewing modes. After clicking a page record, the metric details are displayed as a sidebar by default. You can click the expand button to switch to fullscreen mode for a more complete data display and diagnostic workspace.
## Next Steps
Learn problem diagnosis and optimization methods