> ## Documentation Index
> Fetch the complete documentation index at: https://docs.flashduty.com/llms.txt
> Use this file to discover all available pages before exploring further.
# Flashduty RUM Getting Started
> Learn how to quickly start using Flashduty RUM for frontend performance monitoring
## Quick Start
Using Flashduty RUM requires just a few simple steps to start monitoring your frontend application performance.
### Basic Flow
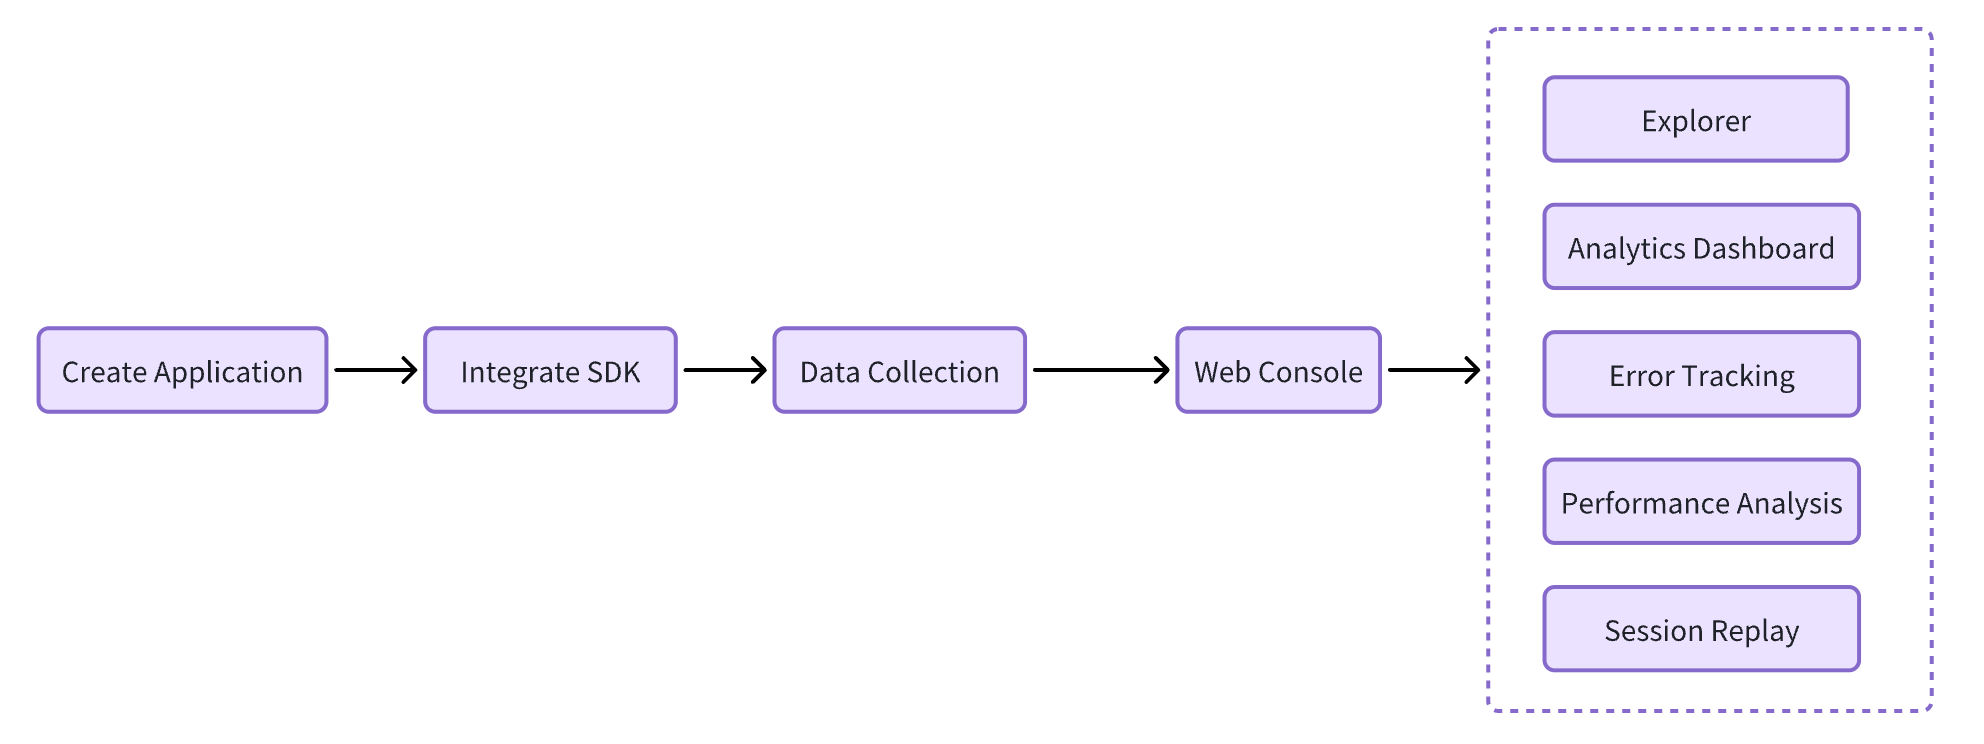 ### Integration Steps
A RUM application is a container for frontend performance monitoring data. We recommend creating applications based on business systems or applications, such as: official website, e-commerce store, admin dashboard, etc.
1. Go to the RUM application list page, click **Create RUM Application**
2. Enter the application name, management team, access level, and alert configuration
3. Click confirm to create
Go to [Application Management](/en/rum/quickstart/app-management) to learn more configuration options.
After creating the RUM application, you need to integrate the SDK into your application.
1. Get SDK integration configuration information on the application details page
2. Choose the appropriate integration guide based on your application type
For web applications, supports CDN and npm integration methods
For Android native apps, supports Gradle dependency integration
For iOS native apps, supports CocoaPods and SPM integration
After SDK integration is complete, the system will automatically collect the following data:
* **Page Performance Metrics**: Load time, first screen time, etc.
* **Resource Loading Performance**: JS, CSS, images, and other resources
* **User Behavior Data**: Clicks, scrolls, and other interactions
* **Errors and Exceptions**: JavaScript exceptions, network errors
* **Network Request Performance**: API call duration and status
Data usually appears in the console within 2-5 minutes.
### Feature Experience
In the RUM console, you can use the following features:
View real-time performance data, analyze page loading bottlenecks
Monitor JavaScript exceptions, quickly locate root causes
Replay user actions, reproduce problem scenarios
Custom query and analyze monitoring data
## Next Steps
* [Data Collection](/en/rum/others/data-collection) - Learn about data types and storage strategies
* [Advanced Configuration](/en/rum/sdk/web/advanced-config) - Customize SDK behavior
* [Troubleshooting](/en/rum/quickstart/faq) - Solve common problems
### Integration Steps
A RUM application is a container for frontend performance monitoring data. We recommend creating applications based on business systems or applications, such as: official website, e-commerce store, admin dashboard, etc.
1. Go to the RUM application list page, click **Create RUM Application**
2. Enter the application name, management team, access level, and alert configuration
3. Click confirm to create
Go to [Application Management](/en/rum/quickstart/app-management) to learn more configuration options.
After creating the RUM application, you need to integrate the SDK into your application.
1. Get SDK integration configuration information on the application details page
2. Choose the appropriate integration guide based on your application type
For web applications, supports CDN and npm integration methods
For Android native apps, supports Gradle dependency integration
For iOS native apps, supports CocoaPods and SPM integration
After SDK integration is complete, the system will automatically collect the following data:
* **Page Performance Metrics**: Load time, first screen time, etc.
* **Resource Loading Performance**: JS, CSS, images, and other resources
* **User Behavior Data**: Clicks, scrolls, and other interactions
* **Errors and Exceptions**: JavaScript exceptions, network errors
* **Network Request Performance**: API call duration and status
Data usually appears in the console within 2-5 minutes.
### Feature Experience
In the RUM console, you can use the following features:
View real-time performance data, analyze page loading bottlenecks
Monitor JavaScript exceptions, quickly locate root causes
Replay user actions, reproduce problem scenarios
Custom query and analyze monitoring data
## Next Steps
* [Data Collection](/en/rum/others/data-collection) - Learn about data types and storage strategies
* [Advanced Configuration](/en/rum/sdk/web/advanced-config) - Customize SDK behavior
* [Troubleshooting](/en/rum/quickstart/faq) - Solve common problems