Monitors supports Loki’s LogQL query syntax, enabling aggregate analysis on log data and triggering alerts.
Core Concepts
Loki’s query language LogQL is divided into two types:
When writing LogQL, the query input autocompletes label names and label values from the data source, helping you locate log streams quickly.
1. Threshold Evaluation Mode
This mode is suitable for scenarios requiring multi-level threshold evaluation on log aggregate values (e.g., Info/Warning/Critical).
Configuration
- Query Statement (LogQL): Write LogQL that returns numeric vectors (select “Do Stats” query mode)
Example: Count log lines containing error keyword in mysql job in the last 5 minutes:
- Threshold Conditions:
- Critical:
$A > 50 (Error logs exceed 50 in 5 minutes)
- Warning:
$A > 10 (Error logs exceed 10 in 5 minutes)
How It Works
The engine executes LogQL query and gets time series data with labels (Vector). The engine iterates through each series, extracting values to compare against configured threshold expressions.
Recovery Logic
2. Data Exists Mode
This mode is suitable for users who prefer writing filter conditions directly in LogQL, or scenarios that only care about “whether anomalous data exists”. Recommended for log anomaly detection alerts.
Configuration
- Query Statement (LogQL): Write LogQL containing comparison operators, returning only data satisfying conditions
Example: Directly filter services with error rate exceeding 5%:
- Evaluation Rules: As long as LogQL query returns data, triggers alert
Pros and Cons Analysis
Recovery Logic
- Recovery When Data Disappears: When LogQL query result is empty, determines recovery
- Recovery Query: Supports configuring additional query statements to assist in determining recovery status
- Manual Close: Keep the alert active until it is closed manually
3. No Data Mode
This mode is used to monitor whether log reporting pipeline is interrupted, or whether logs that should be continuously generated have stopped.
Configuration
- Query Statement (LogQL): Write a query that is expected to always have data
Example: Count log reporting rate from all hosts:
- Evaluation Rules: If a Series (uniquely identified by labels, like
instance="host-1") existed in previous cycles but cannot be found in current and N consecutive cycles, triggers “No Data” alert
Recovery Logic
No-data alerts support configuring the alert ending mode, which decides how the alert ends:
Typical Applications
- Monitor whether Promtail/Fluentd and other collection Agents have stopped working
- Monitor whether critical business logs (like order creation logs) are abnormally interrupted
4. Using a raw log query as the primary query
To alert whenever matching log rows exist, select Raw log and use Data exists mode. Suppose the query returns job, service, __time__, and __log__:
- Label fields: Select stable dimensions such as
job and service to identify the alert object.
- Value fields: Leave this empty in Data exists mode. If you use Threshold evaluation, select a field that can be converted to a number.
- Additional information:
__time__, __log__, and any other unselected non-value fields are automatically carried with the alert.
Do not use frequently changing fields such as __time__, __log__, or a trace ID as labels. Otherwise, each log row may create a different alert object.
See Query Result Field Mapping for default behavior, threshold references, and multi-query matching requirements.
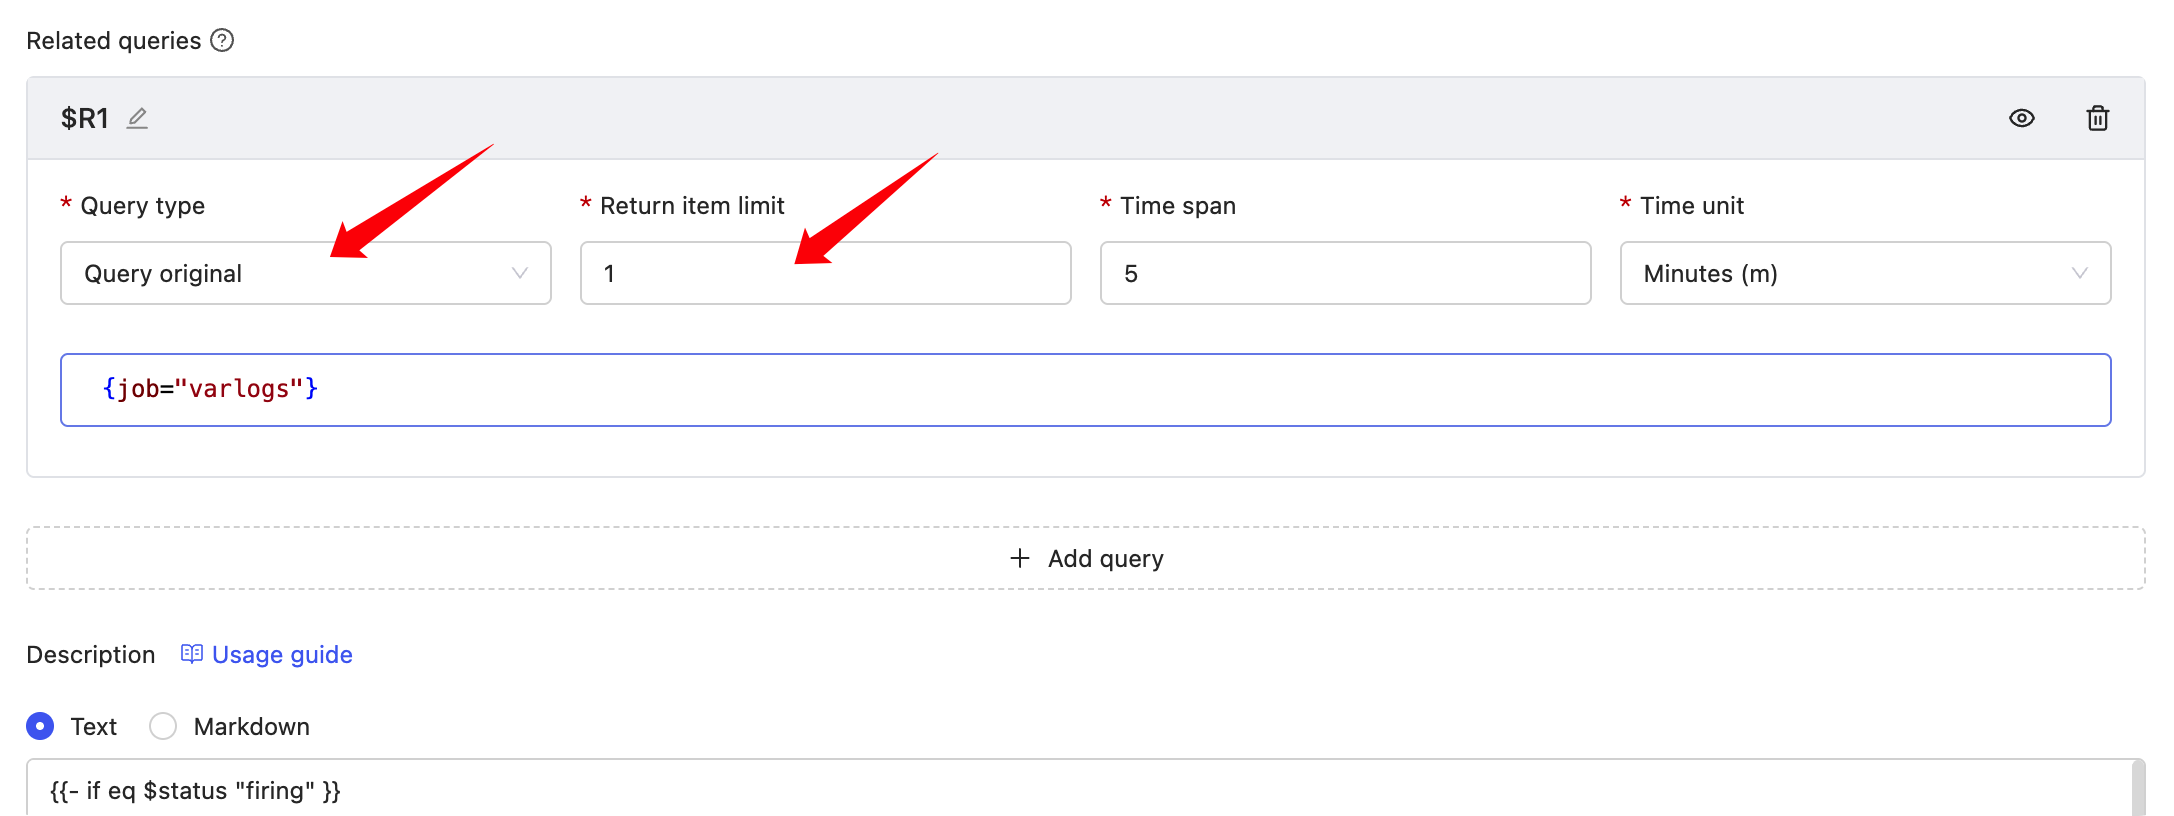
Original logs can be obtained through related queries during alerts. But typically not recommended to get too many; just get 1 as a log sample to include in alert message.
Related query results can be rendered in “Notes Description”, example: