

Features
- Error reporting: the SDK captures unhandled errors automatically, and you can report handled errors manually with context
- Error grouping: groups similar error events into one Issue to reduce duplicate alerts
- Issue overview and details: view an Issue’s occurrences, stack traces, affected users, and session timeline
- Source mapping: upload symbol files to restore minified or obfuscated stacks to original code locations
Error tracking workflow
1
Find the problem
- Data analysis: view error rate and error type trends in the Errors tab of the analytics dashboard
- Alert notifications: turn on alerts in the application to notify a channel when errors occur
- Active inspection: review the Issue list and trends in the Error tracking module
2
Locate the cause
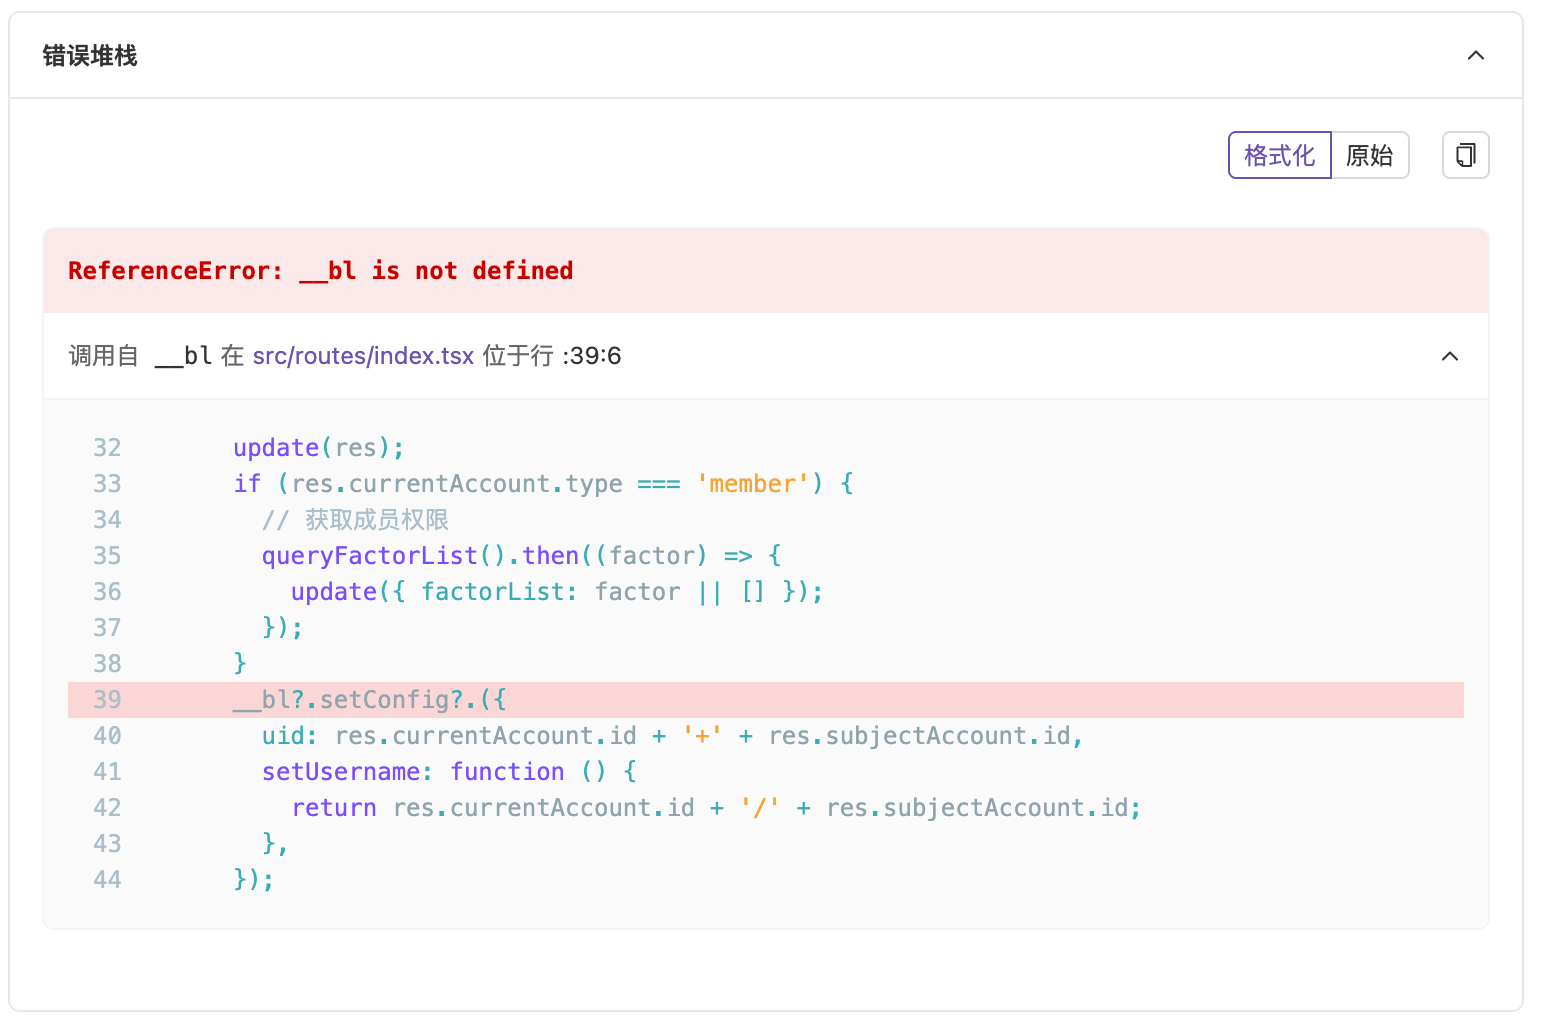
In the Issue details, review the stack trace, user environment, and the session timeline that led to the error.
Contextual information
- User Environment: Browser type, device model, operating system
- Error Stack: Detailed call stack information
- Session Timeline: Operation path that triggered the error
Problem localization tools
- Error Analysis Panel
- Source Mapping
Through the error analysis panel, you can view the aggregated Issue list, error trends, and detailed information.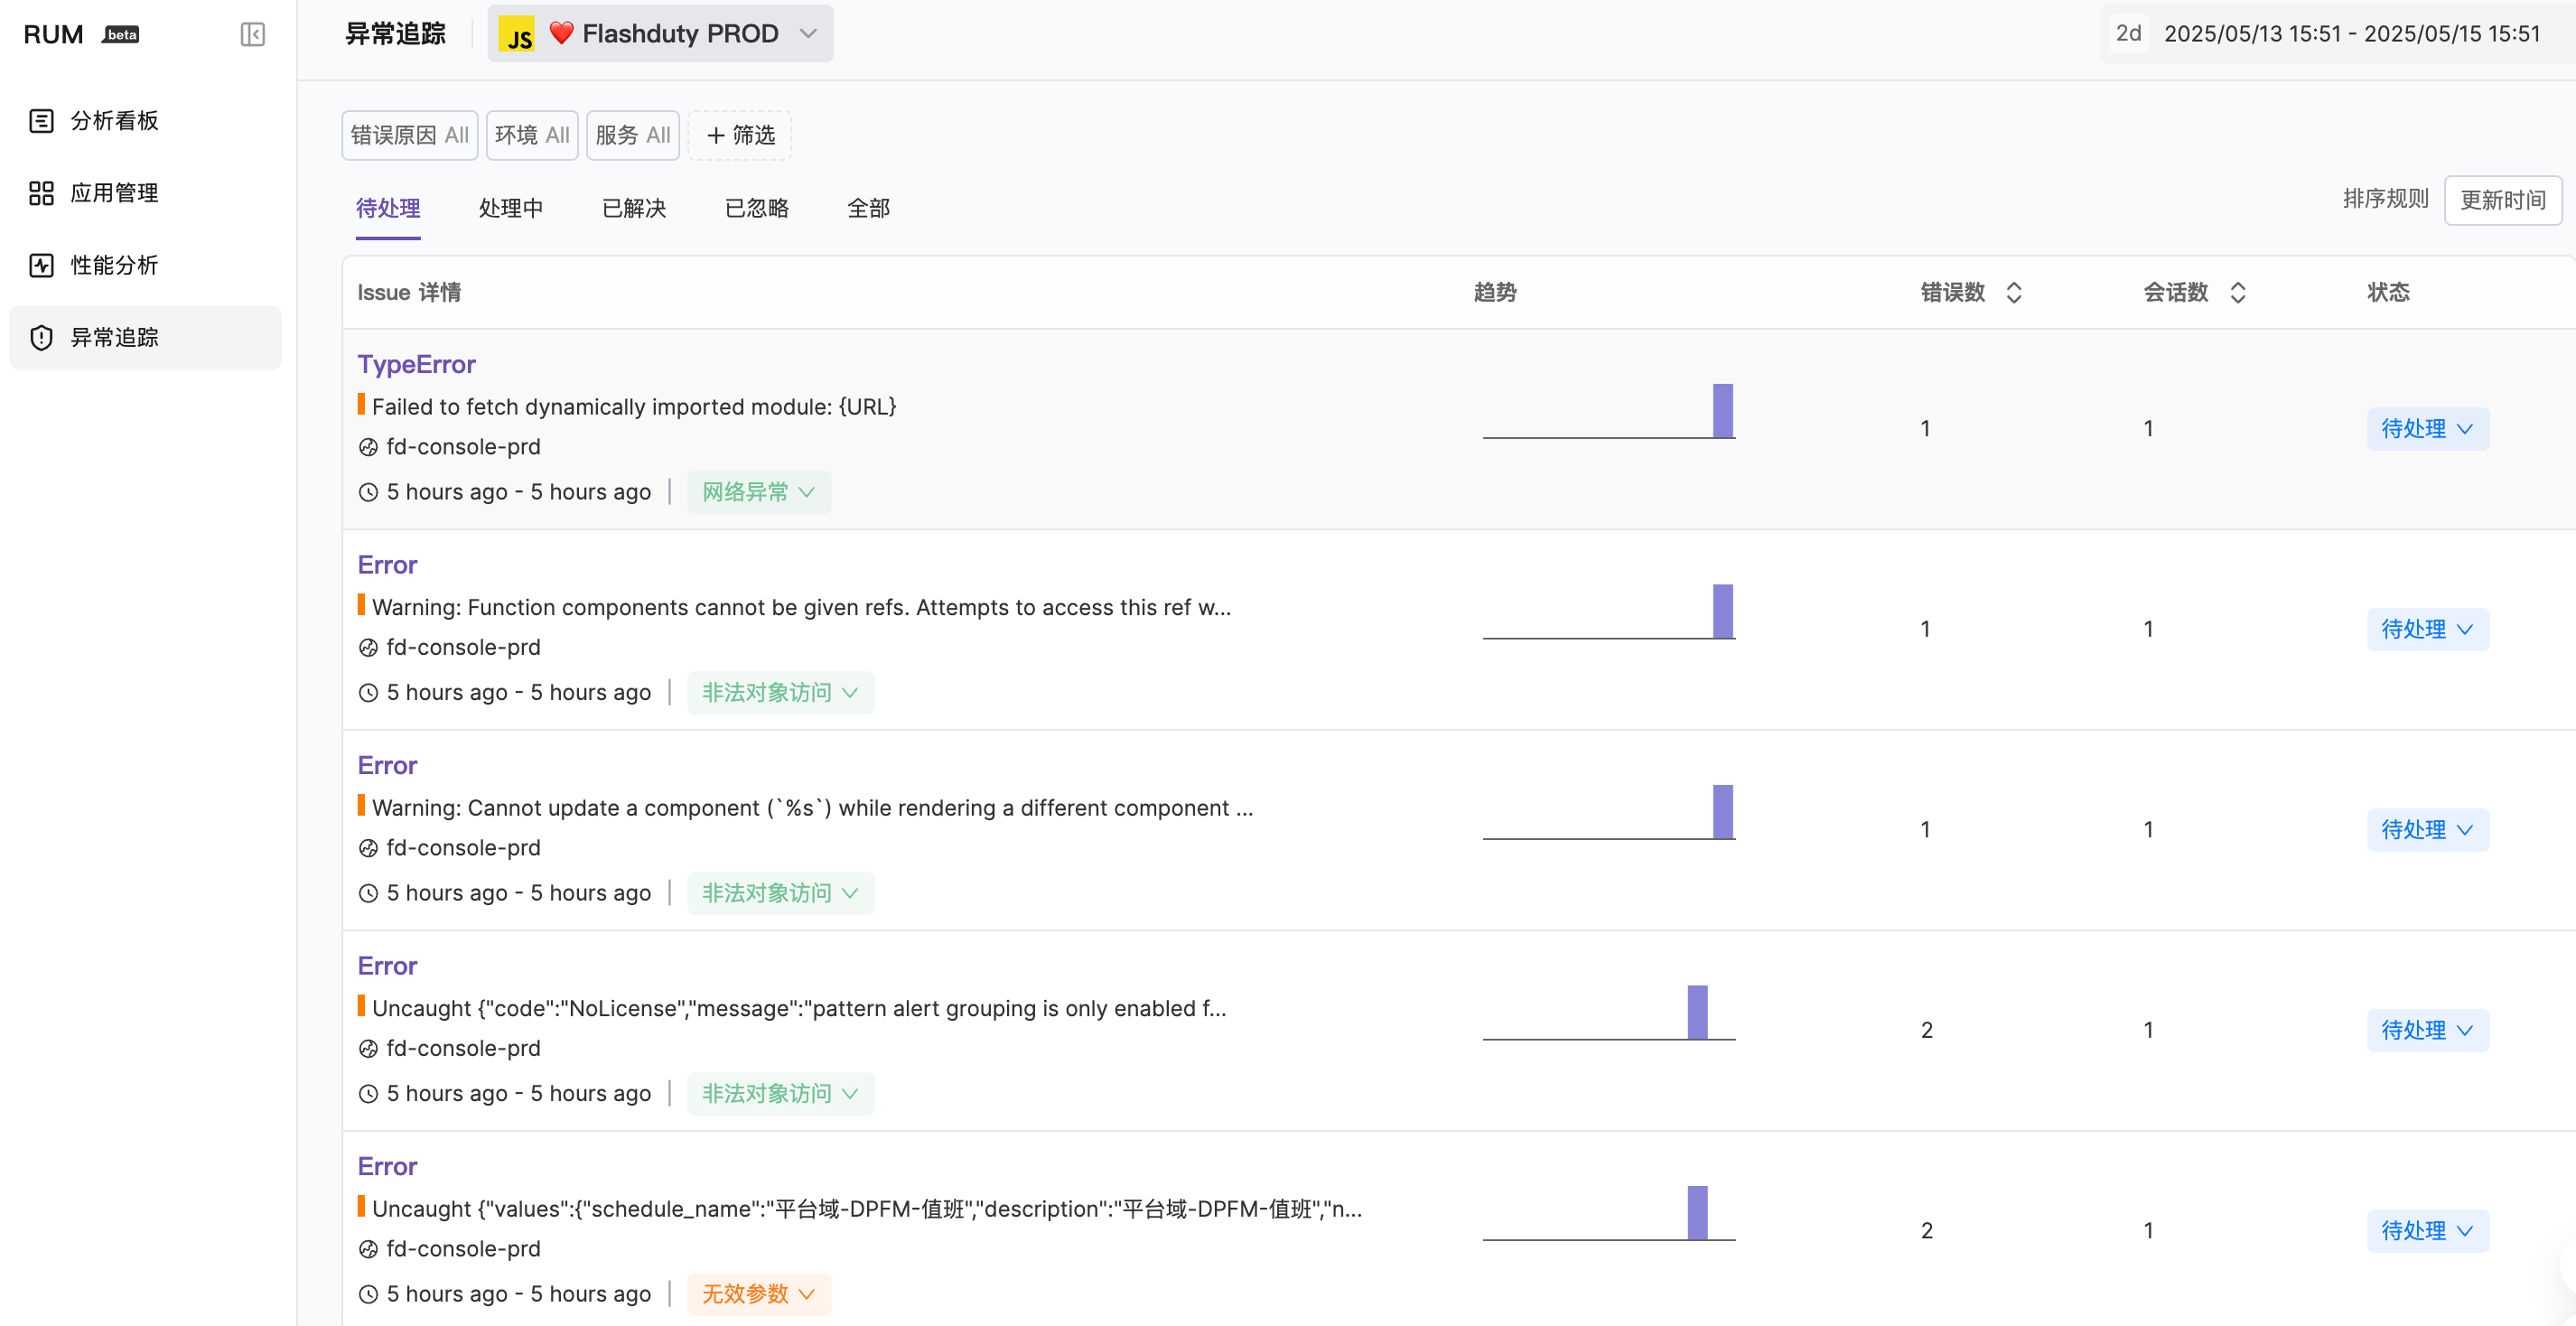
Next steps
Error Reporting
Learn about error reporting rules and methods
View Errors
View and analyze error details
Source Mapping
Configure source mapping to improve debugging efficiency
Error Grouping
Learn about error grouping mechanisms