

Core features
Performance Metrics Monitoring
Automatically collect and analyze key performance metrics (such as FCP, LCP, CLS, INP), providing a comprehensive view of performance data
Resource Loading Analysis
Monitor and analyze the loading performance of static resources (such as JS, CSS, images) to identify slow-loading resources
API Performance Tracking
Track and analyze the performance of backend API calls, including response time, success rate, and other metrics
Performance monitoring workflow
Flashduty RUM performance optimization consists of three key phases:1
Problem Identification
Quickly discovering performance problem trigger points is the first step in diagnosis. Flashduty RUM provides the following ways to help you identify problems: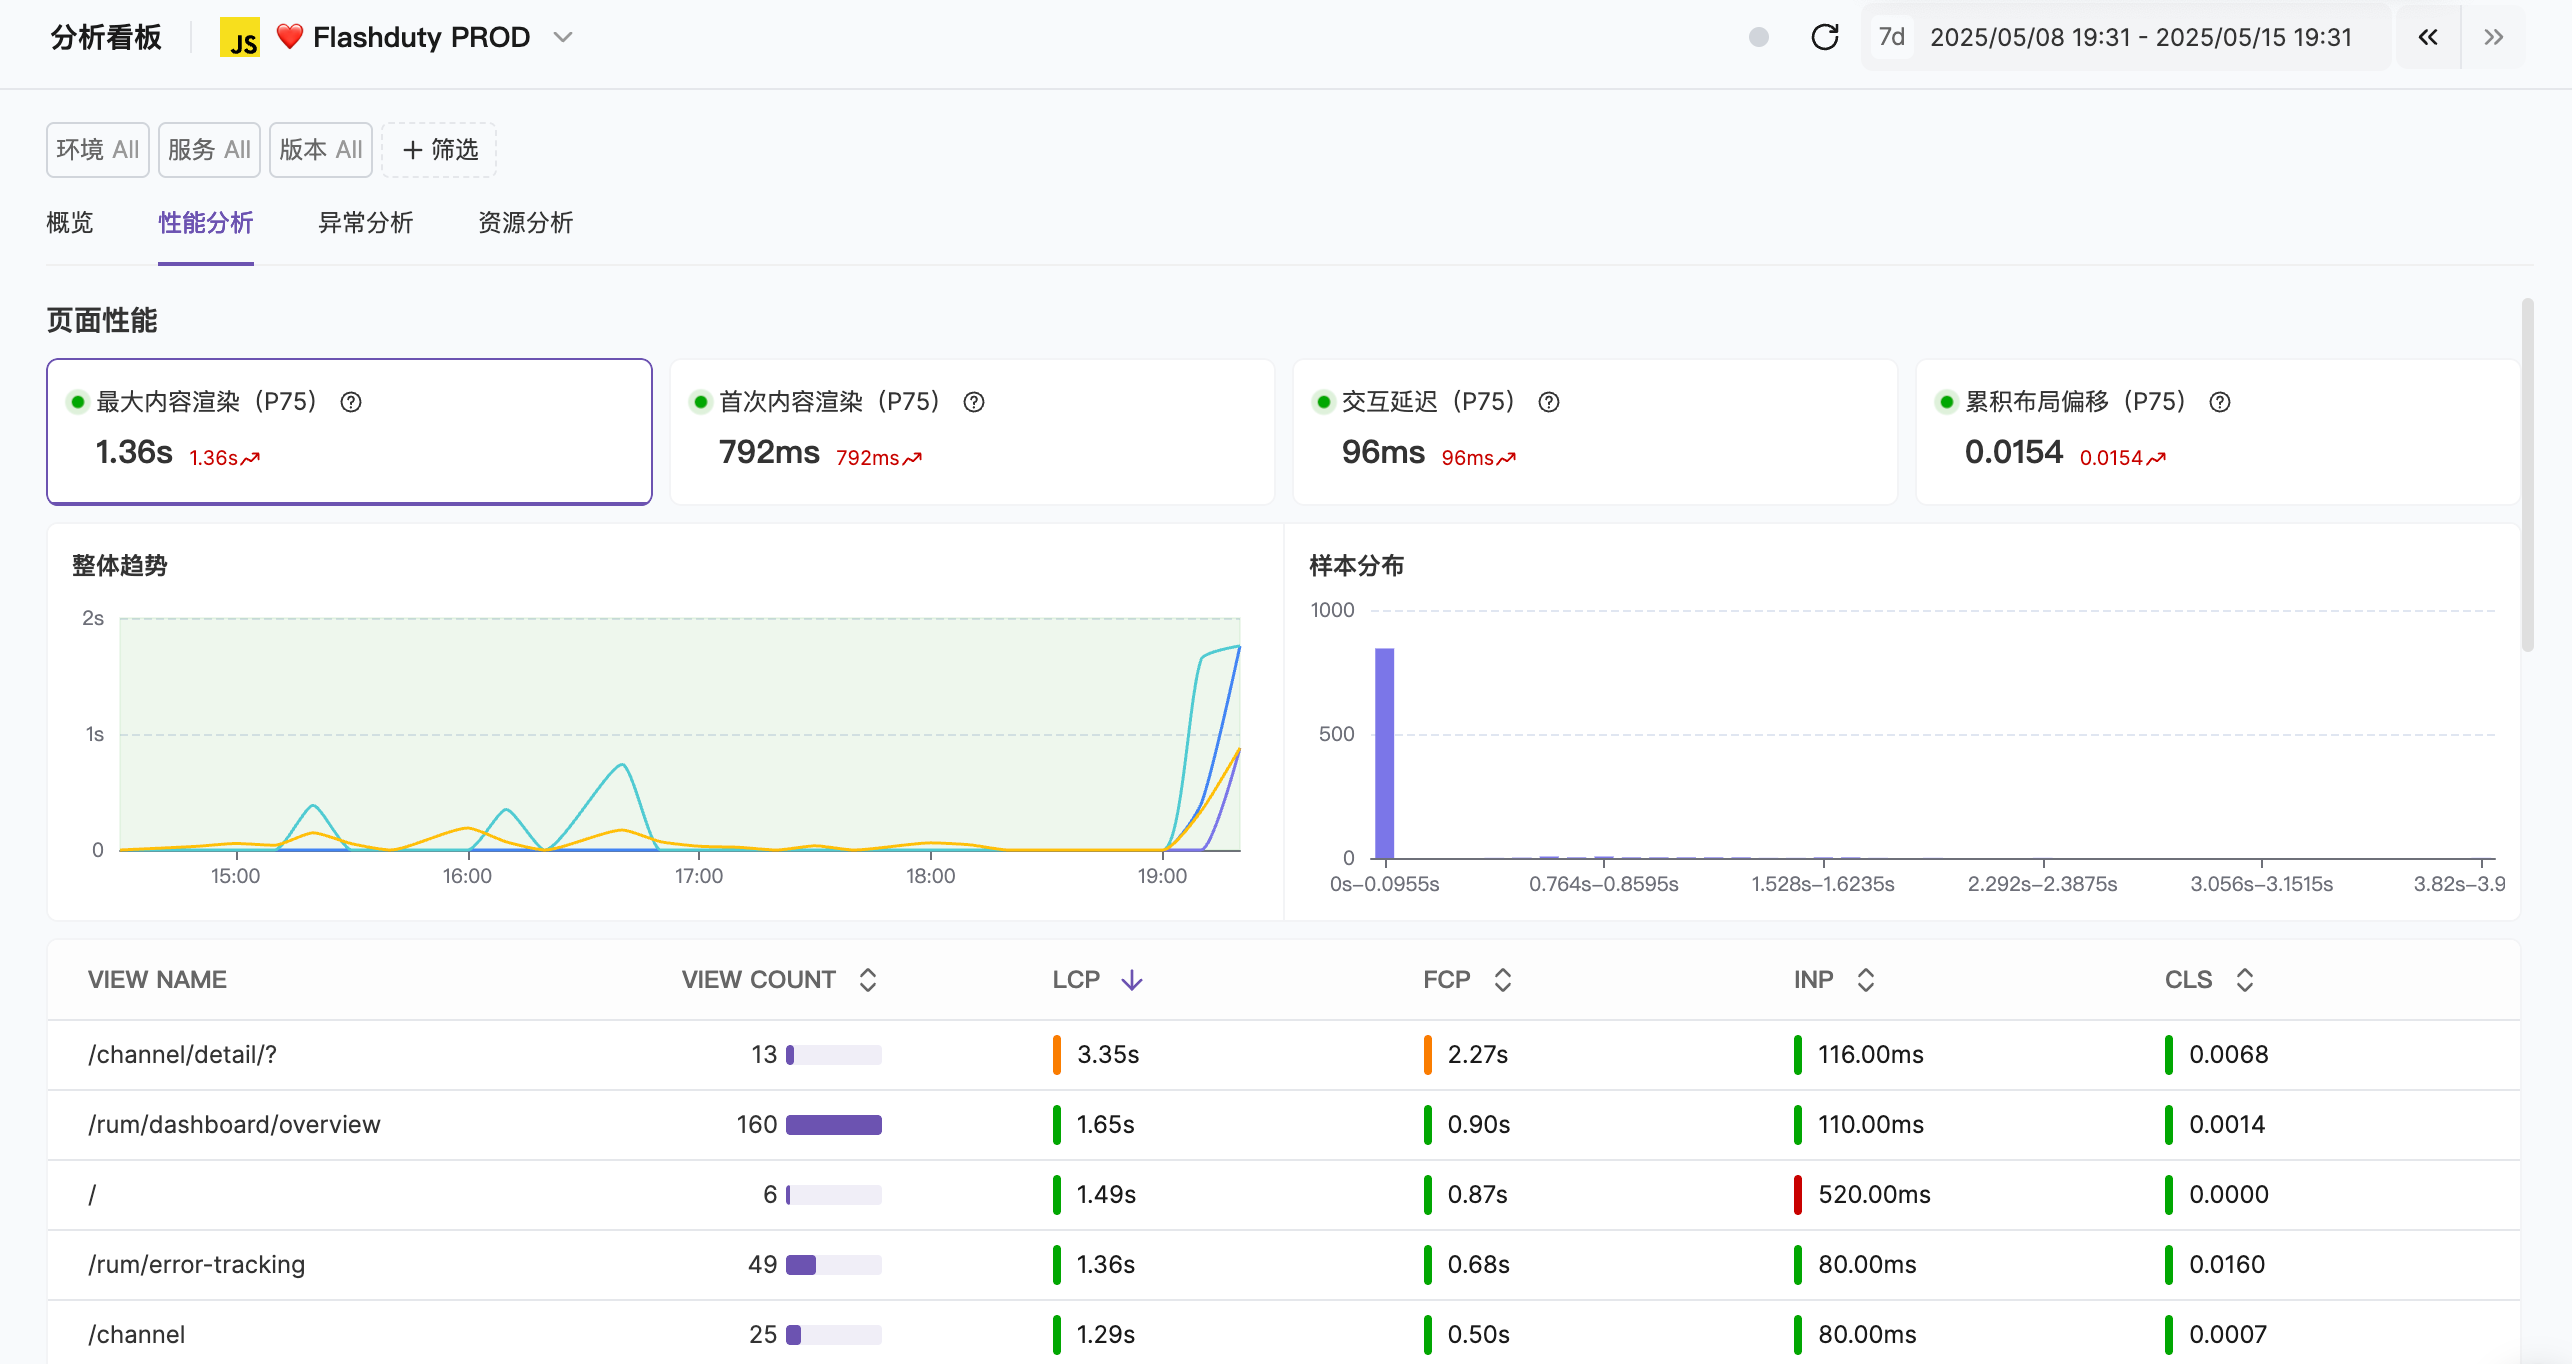 Initial Assessment:
- Data Analysis: View data trends of core performance metrics through the “Application Management - Data Analysis” module
- User Feedback: Discover potential problems through user reports (such as slow page loading or interaction lag)
- Anomaly Detection: Observe anomaly trends, such as increased resource loading failure rates or extended API response times
- Impact Scope: Determine the user groups affected by the problem (for example, specific regions, devices, or browsers)
- Severity: Assess the direct impact of the problem on user experience
- Business Impact: Analyze the impact of the problem on key business metrics (such as conversion rate or user retention)
2
Data Collection
Flashduty RUM provides rich performance data and contextual information:Core Performance Data:
- Page Loading Metrics: Including LCP, FCP, INP, and CLS
- Resource Loading Time: Analyze loading time of images, scripts, CSS, and other resources
- Long Tasks: Tasks that run on the main thread for more than 50 milliseconds
- Network Requests: Record API request latency, success rate, and error rate
- User Environment: Browser type, device model, operating system, and network conditions
- Error Logs: Capture detailed information about JavaScript errors, network errors, and resource loading failures
3
Problem Localization and Classification
Through visualization tools and analysis features, classify performance problems and precisely locate root causes.
Common problem classification
Performance waterfall chart
The performance waterfall chart displays the complete timeline of page loading, helping you identify bottlenecks.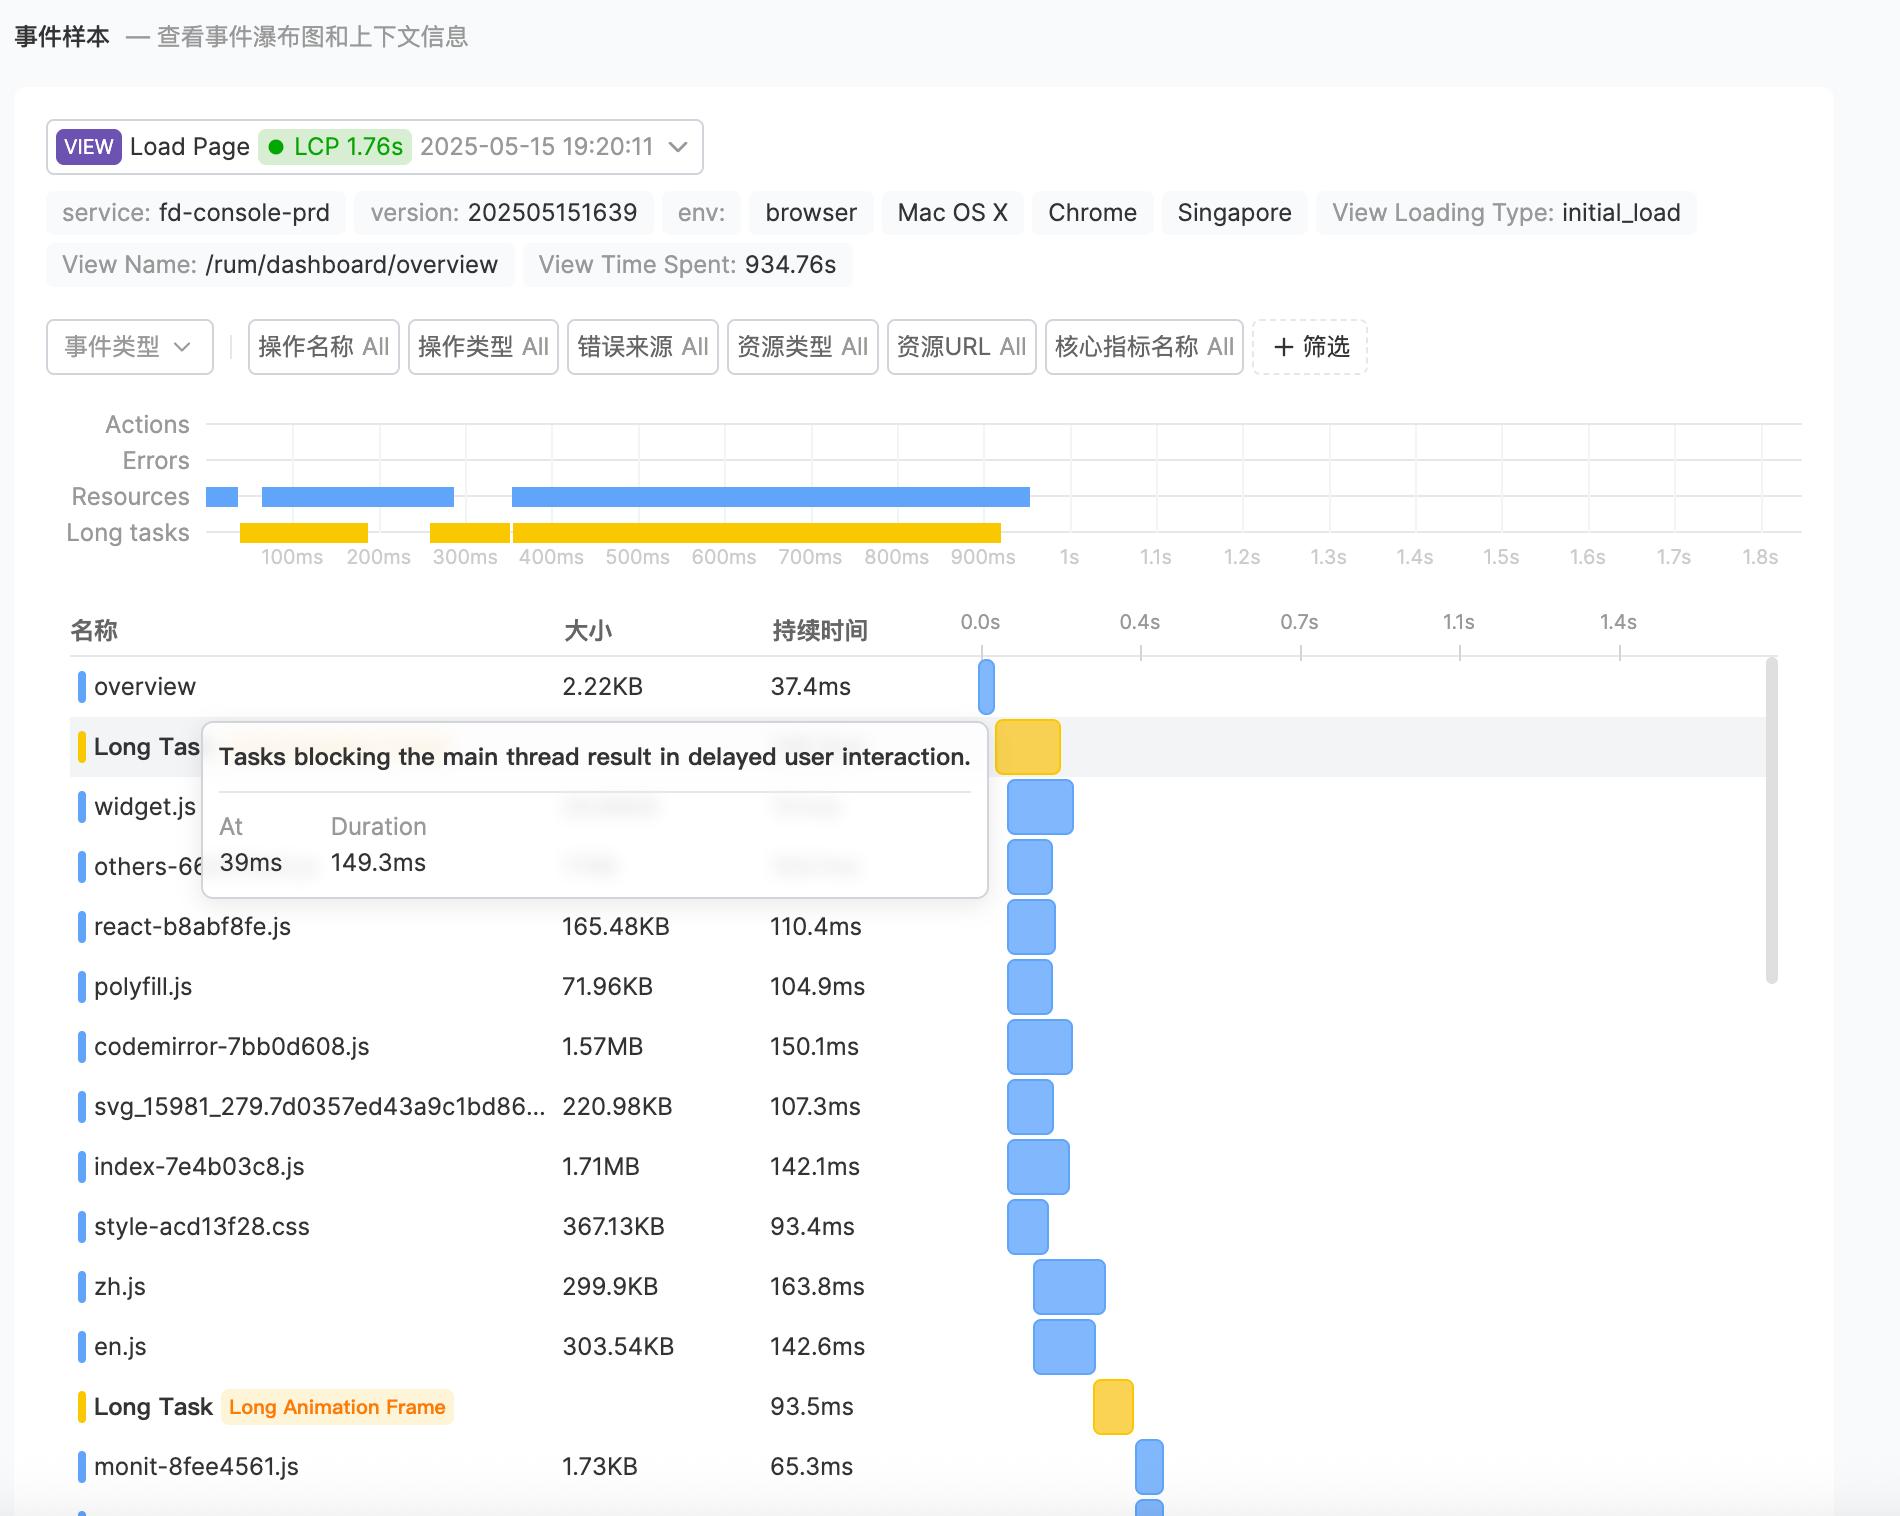
- Navigation Start: Time when user initiates page request
- DNS Lookup: Domain name resolution time
- TCP Connection: Time to establish server connection
- Time to First Byte (TTFB): Time to receive the first byte of server response
- DOM Complete: Time when page DOM structure is fully loaded
- Critical Path: Identify critical resources affecting page rendering
- Blocking Resources: Discover scripts or stylesheets blocking rendering
- Loading Order: Optimize resource loading priority
- Resource Size: Check for oversized resources
Next steps
Metrics Reporting
Learn about metrics collection and reporting mechanisms
Performance Analysis
Deep dive into performance data analysis
Diagnosis and Optimization
Learn problem diagnosis and optimization methods