

Select an application
Use the application selector in the top navigation bar to pick an application; the Explorer then shows only that application’s RUM data. Switch applications to switch data views.Search and filter
Enter query conditions in the search bar and choose a visualization type to search and filter RUM events. For query syntax, see the Data Query Guide.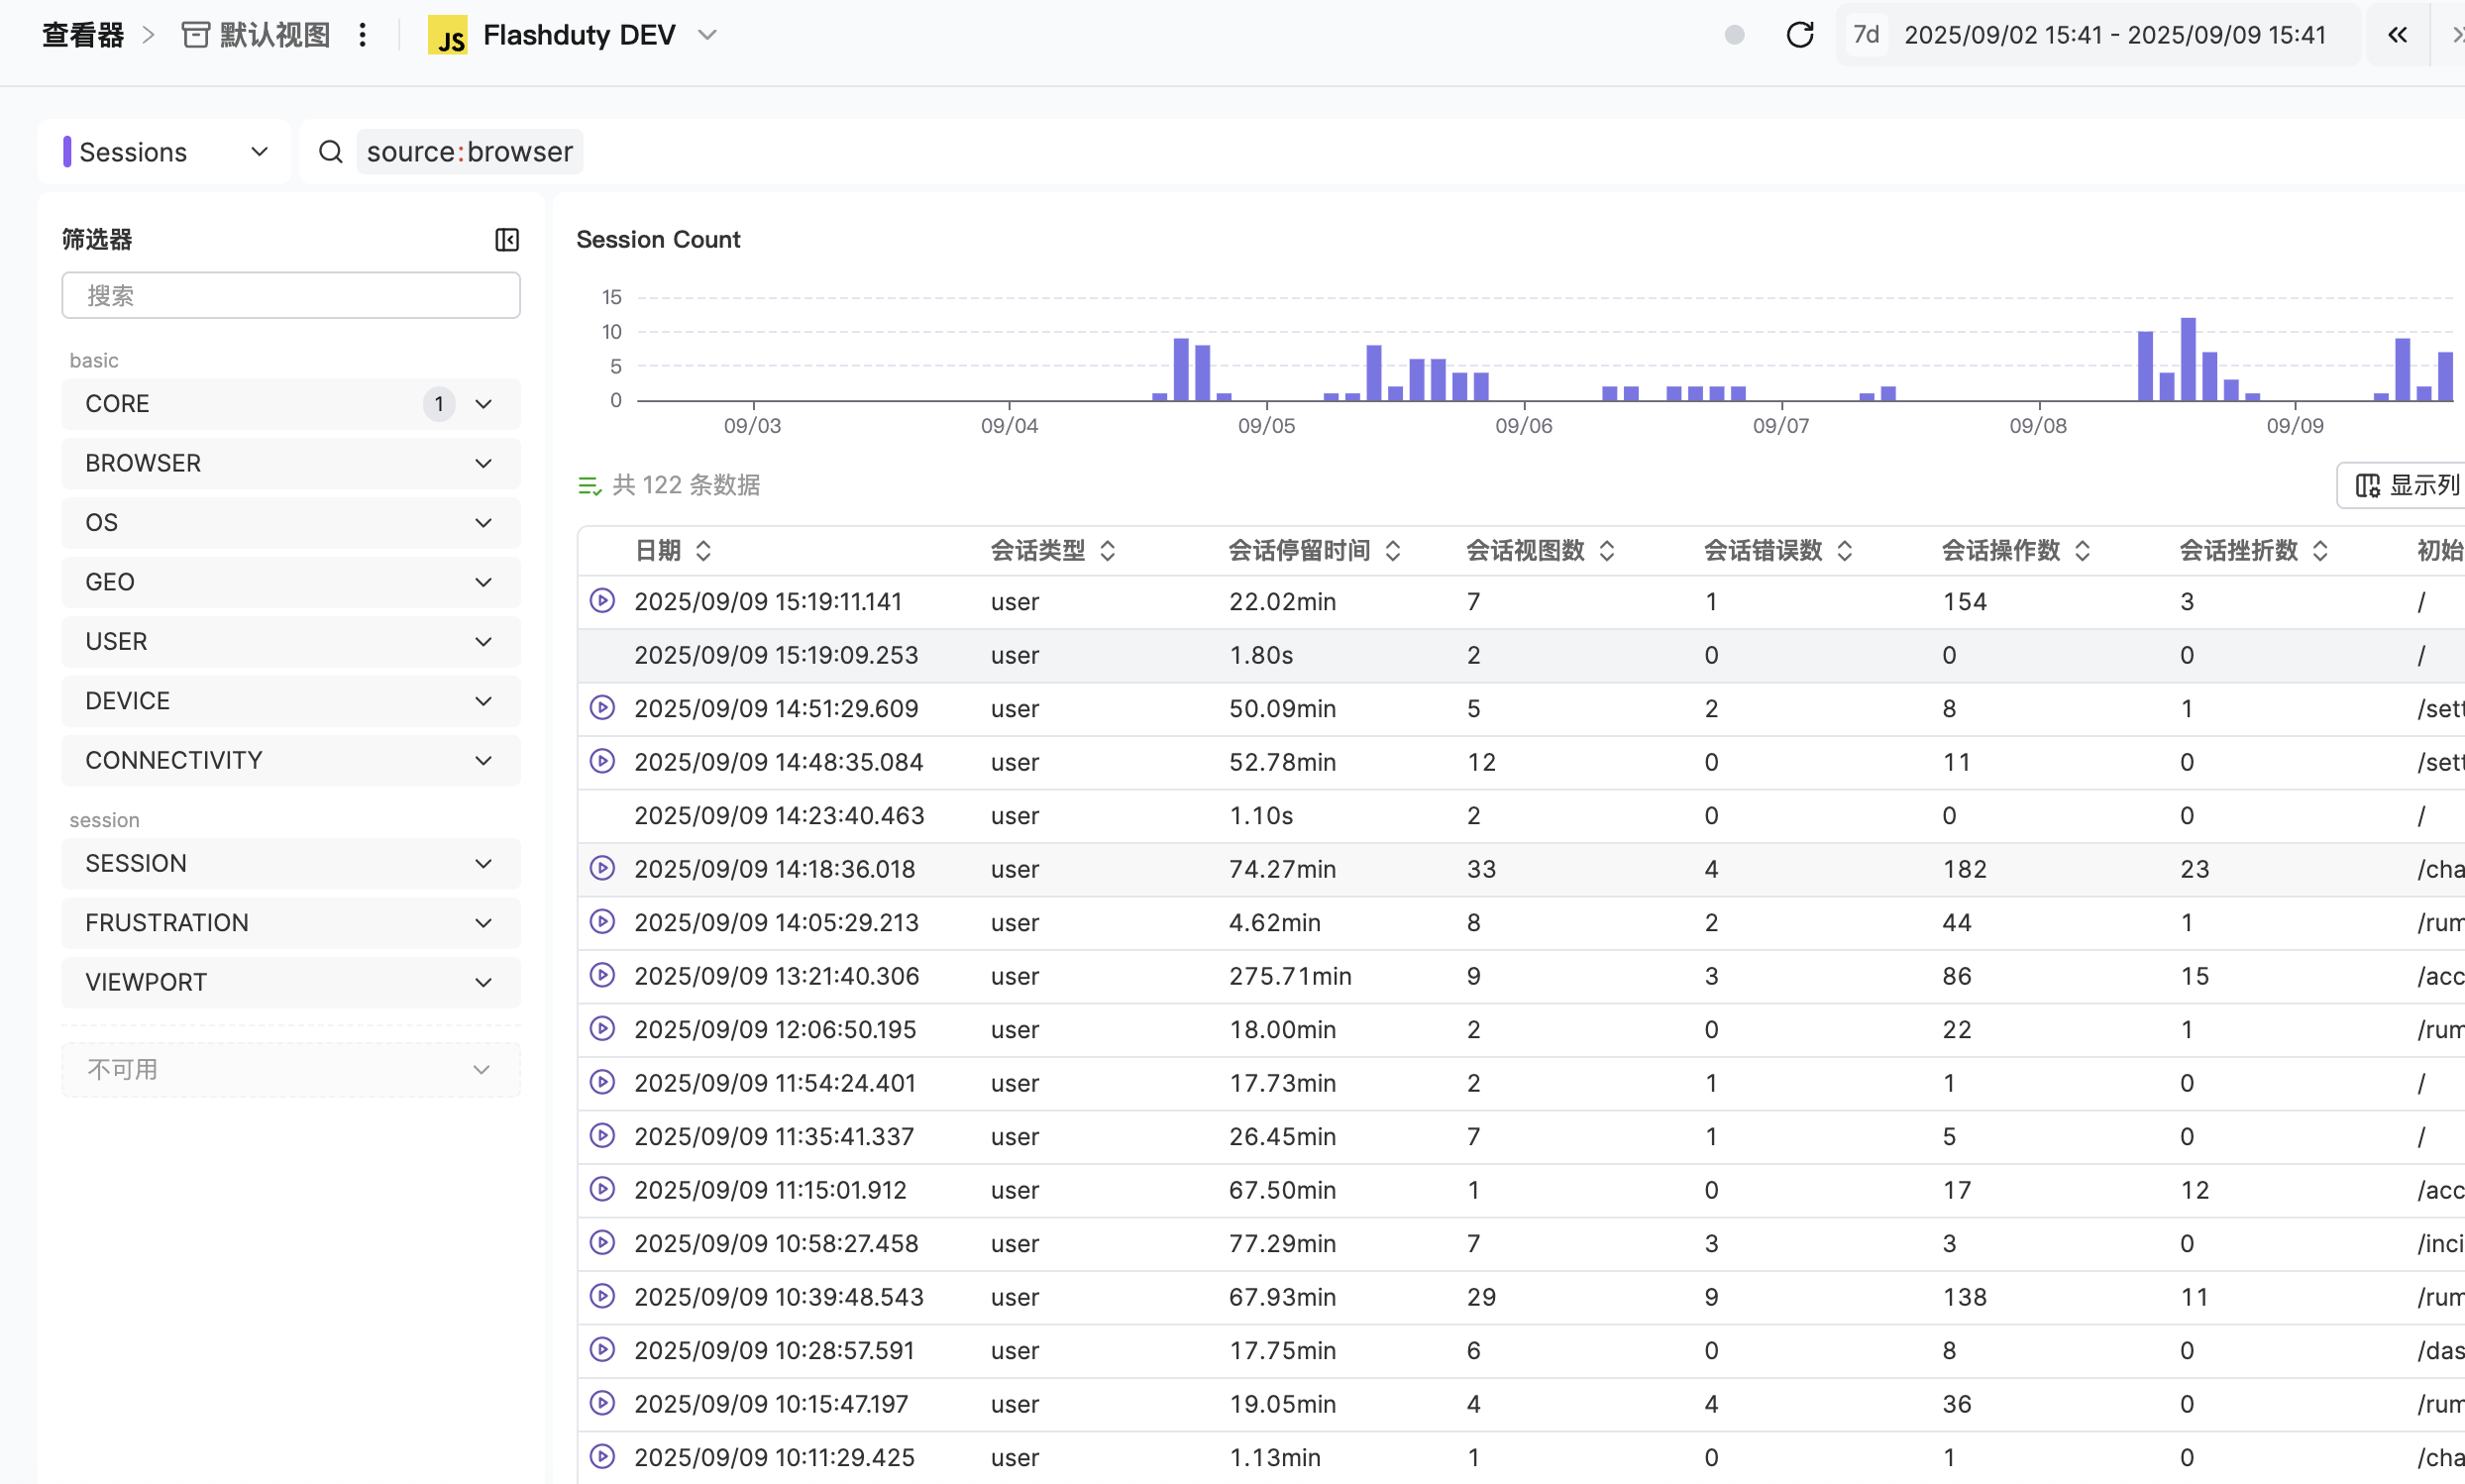
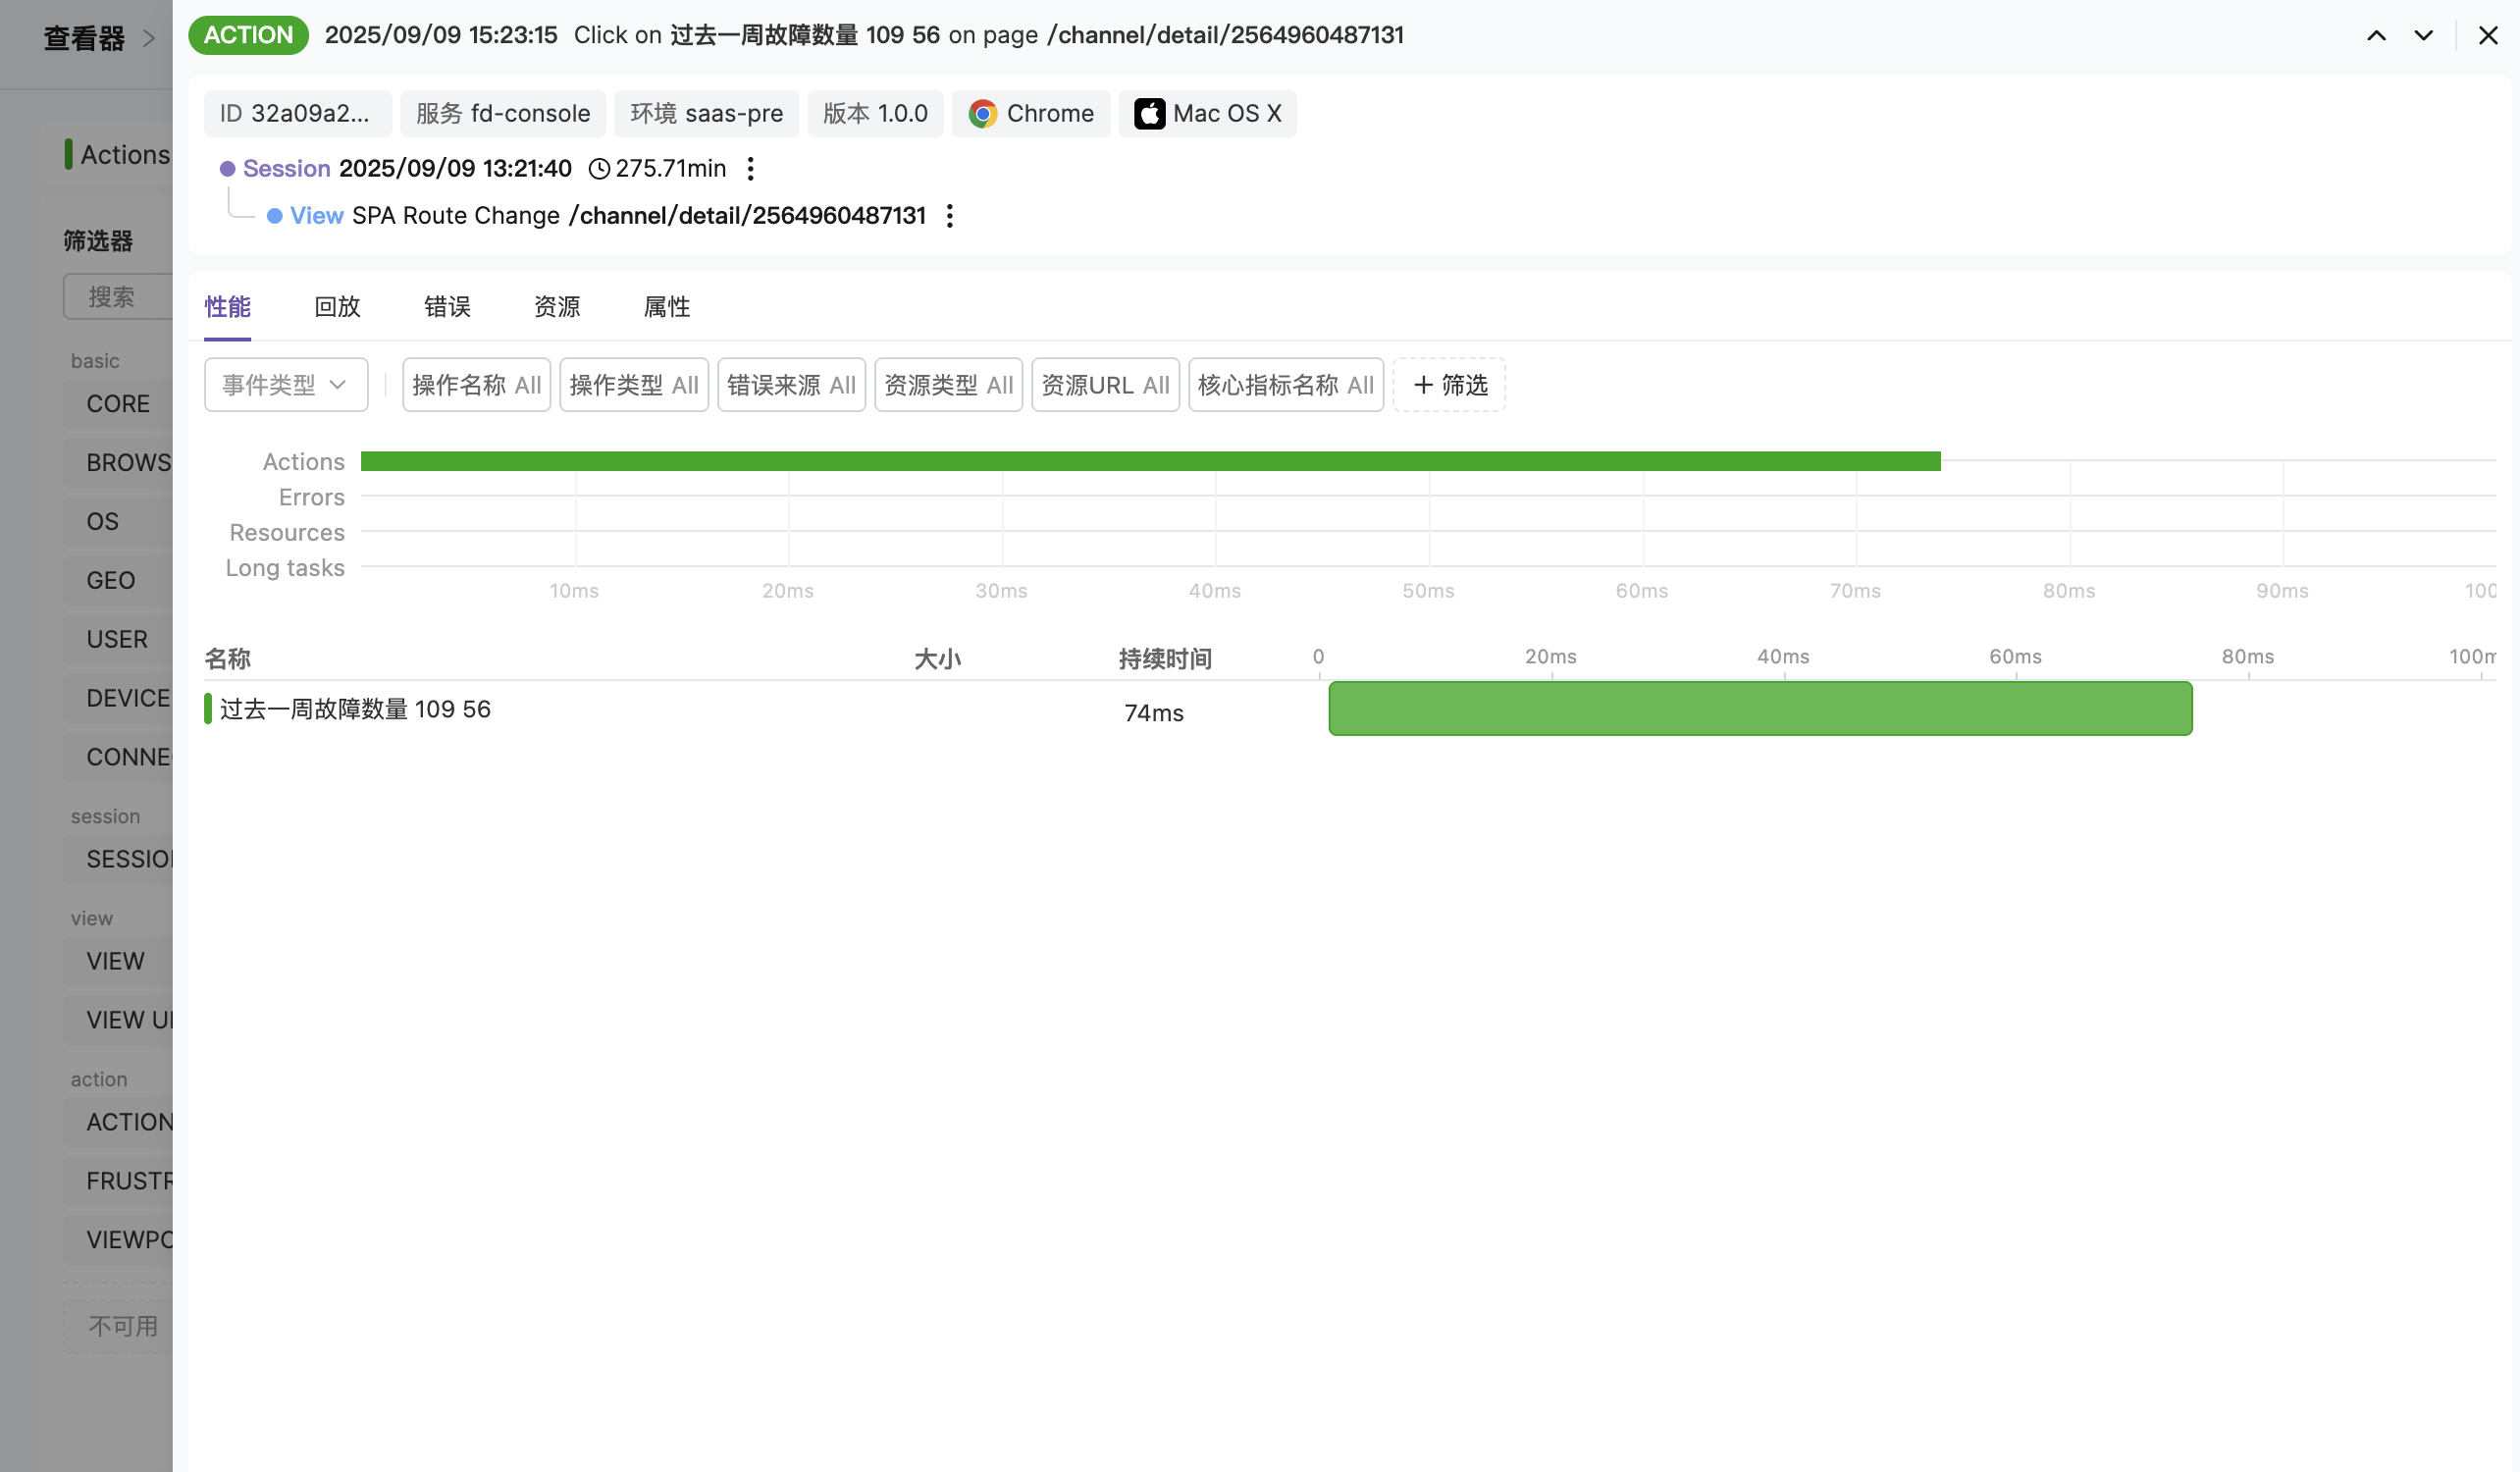
View event details
Click a data item to open its details and see the RUM event from several angles:- View data relationships, drill down into data, or view parent node details
- View resource traces and correlate with existing monitoring system traces
Platform-aware view metrics
In a View’s detail panel, the metric cards on the Performance tab adapt to the View’s platform. You see only the metrics that platform reports.The platform is determined by the View event’s own
source field — no manual switching needed. For Mini Programs, onload_to_onshow and onshow_to_onready cover the two segments of the page lifecycle and help diagnose slow cold starts.view_first_render, view_onload_to_onshow, view_onshow_to_onready.
Saved views
Save the current query state as a view to switch quickly between analysis scenarios. Each account can create up to 20 saved views, and views are only visible to you.What a view saves
View operations
Event export
The event table in the Sessions Explorer provides a CSV Export button that exports the data under the current filter conditions and column configuration.- Export limit: A single export caps at 5000 rows. If the filtered data exceeds the limit, a toast notification appears after export completes, indicating that the first N rows were exported and more data remains.
- Column matching: Exported columns match the current event type’s column settings — names, order, and units follow the on-screen configuration.
- Cancel export: Clicking the button again during an export cancels it; any fetched data is not saved.
- Scope: All view types in the Sessions Explorer event table support export.
Next steps
Data Query Guide
Master query syntax for precise data location
Analytics
Summarize RUM events with aggregations, groups and charts
Distributed Tracing
Learn distributed tracing best practices