

Diagnosis and Optimization Workflow
You can navigate to the optimization page, located under the Performance Monitoring menu, and select the metric you want to analyze. You can also jump to this feature by viewing corresponding performance data in the analytics dashboard.1
Metric Selection
After selecting a page and metric, you can start performance data analysis:
- Click on a metric card to select the metric to analyze
- Select a group in “Show Filter Breakdown”
- Evaluate metrics at different percentiles (e.g., p75 represents the 75th percentile value)
The platform is determined by the application’s own type, so no manual switching is required.
first_render, onload_to_onshow, and onshow_to_onready come from the WeChat Mini Program SDK: first_render is the time to first render, while onload_to_onshow and onshow_to_onready correspond to the two segments of the mini program page lifecycle and help you troubleshoot slow cold starts. After you switch applications, the metric cards refresh to the new platform’s metric set, and the tree map (metric view) metric dropdown likewise lists only the metrics available for the current application platform.2
Data Viewing
You can view the data performance of the metric under different conditions by adjusting the data aggregation method or modifying filter conditions, thereby advancing diagnosis and optimization work.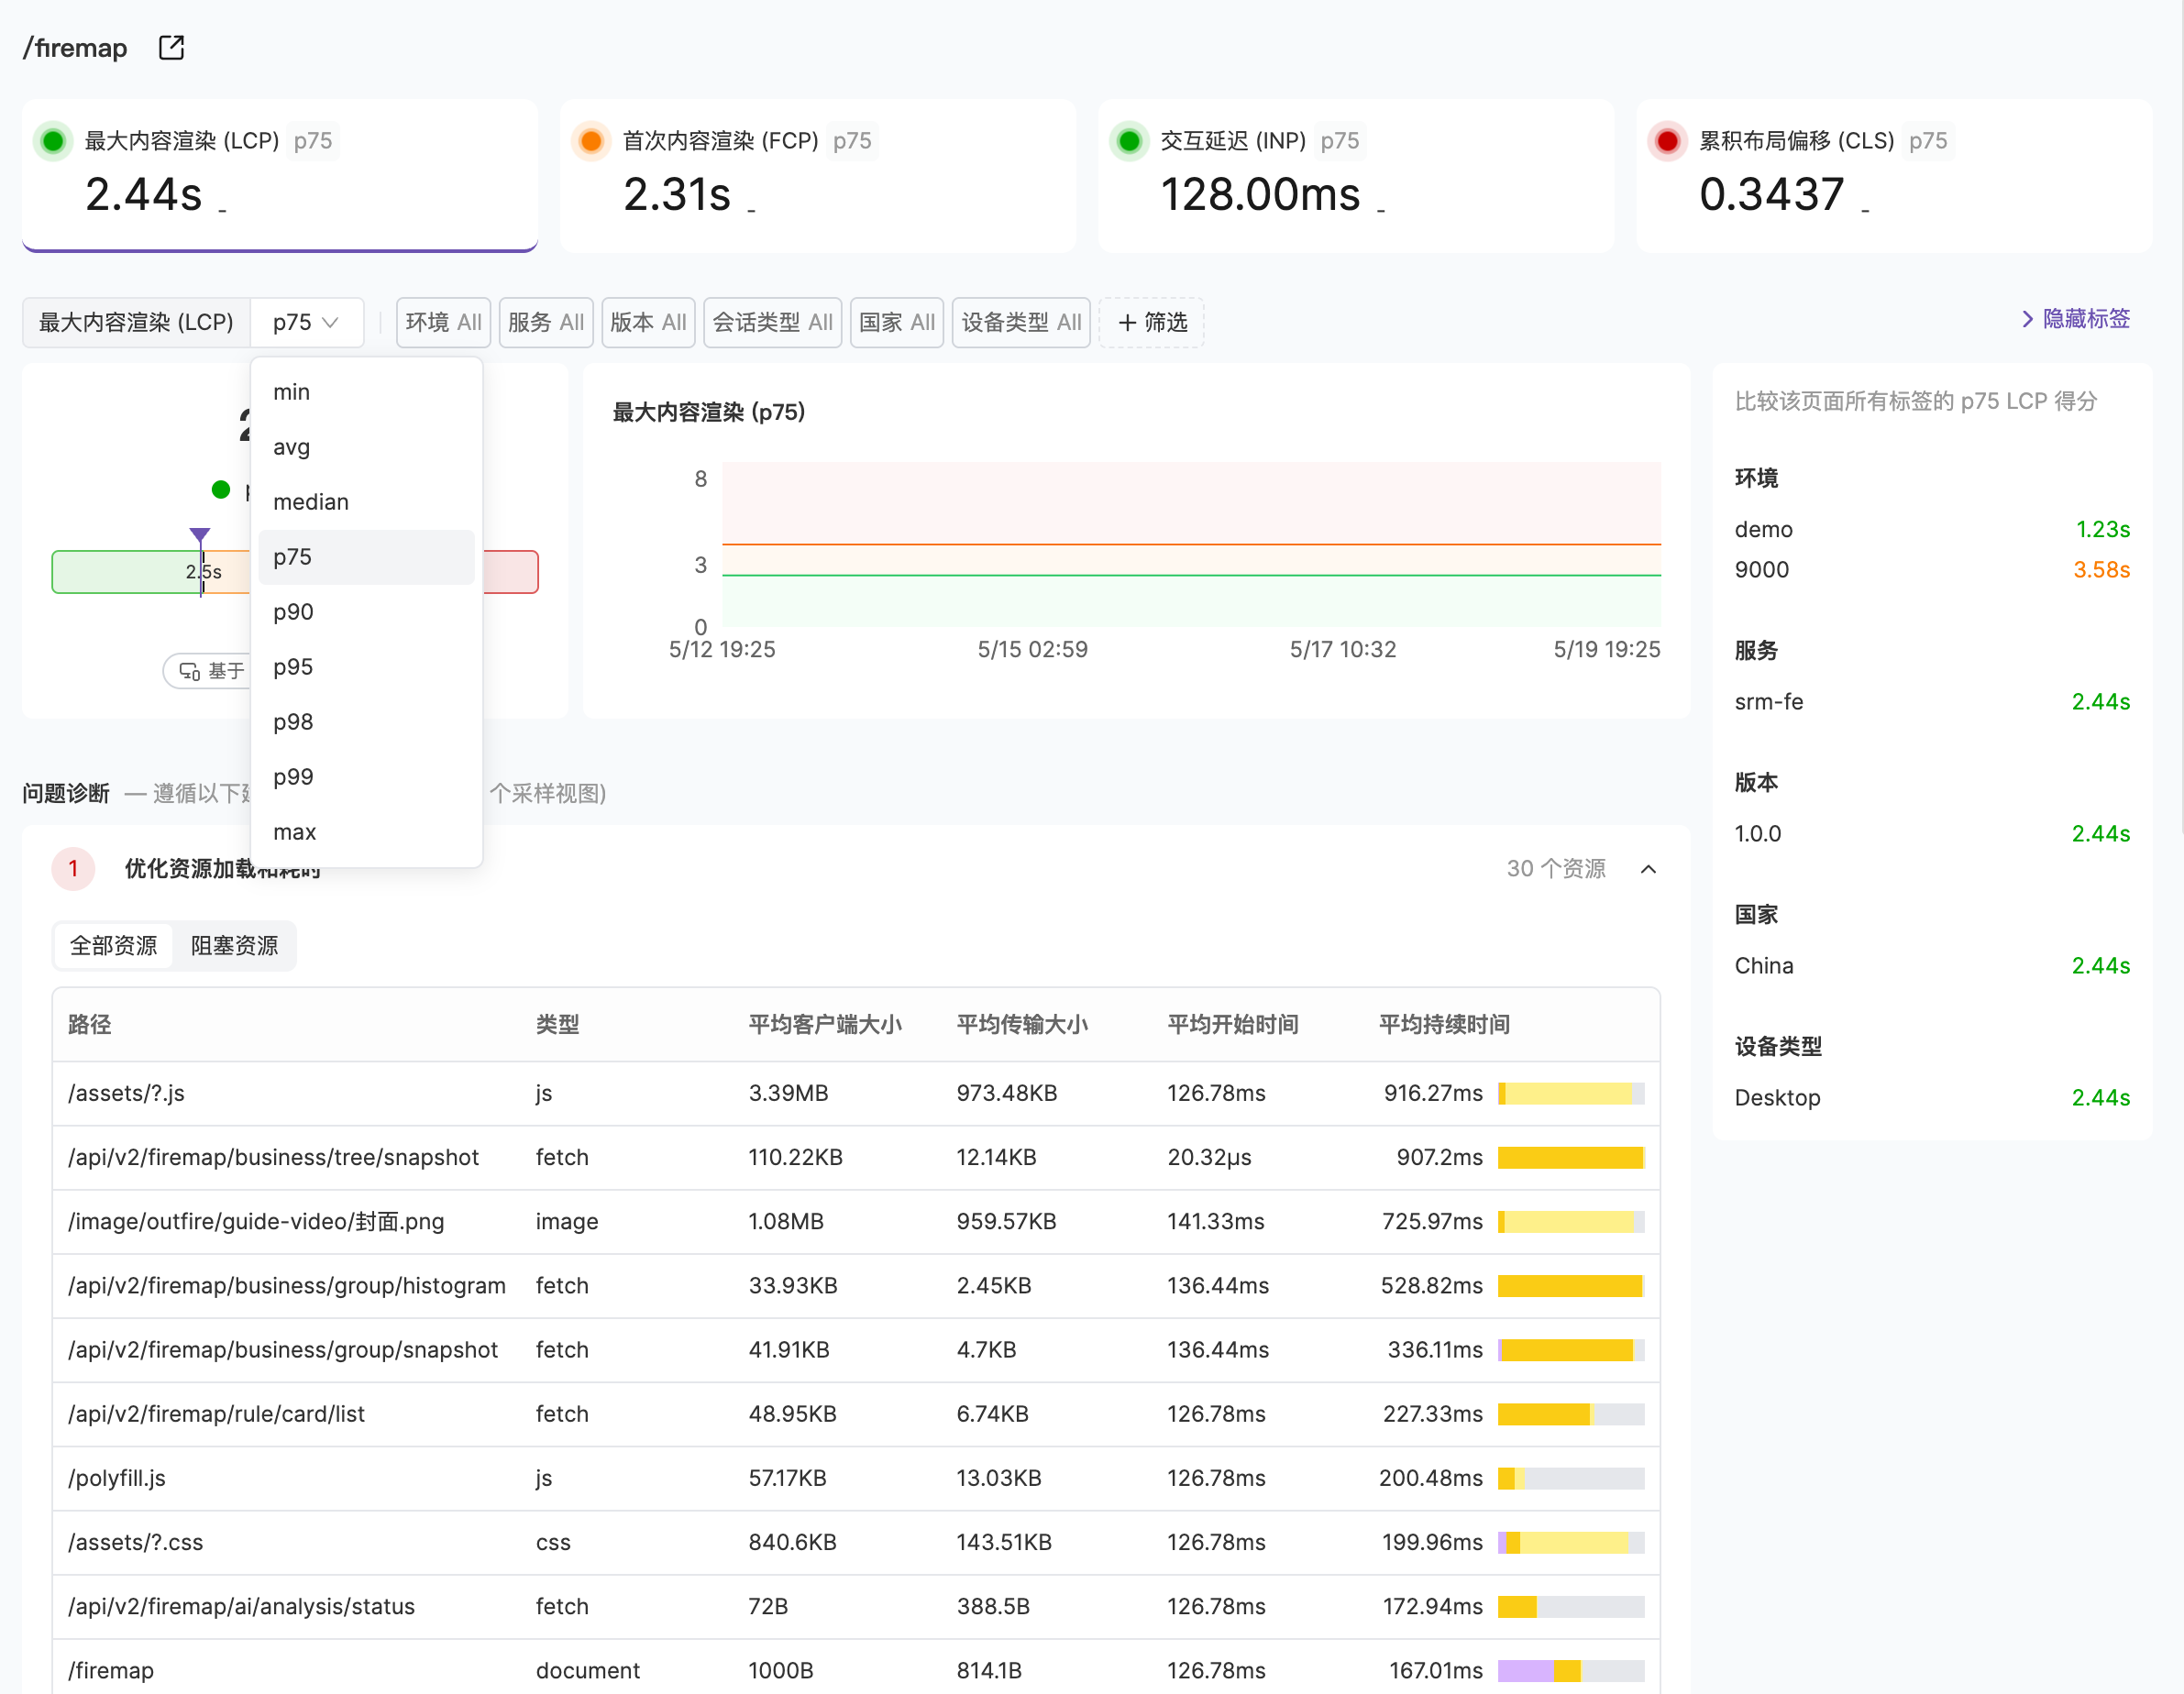
3
Problem Diagnosis
In the problem diagnosis section, you can see resources and errors that users encountered on the page that may affect metric performance.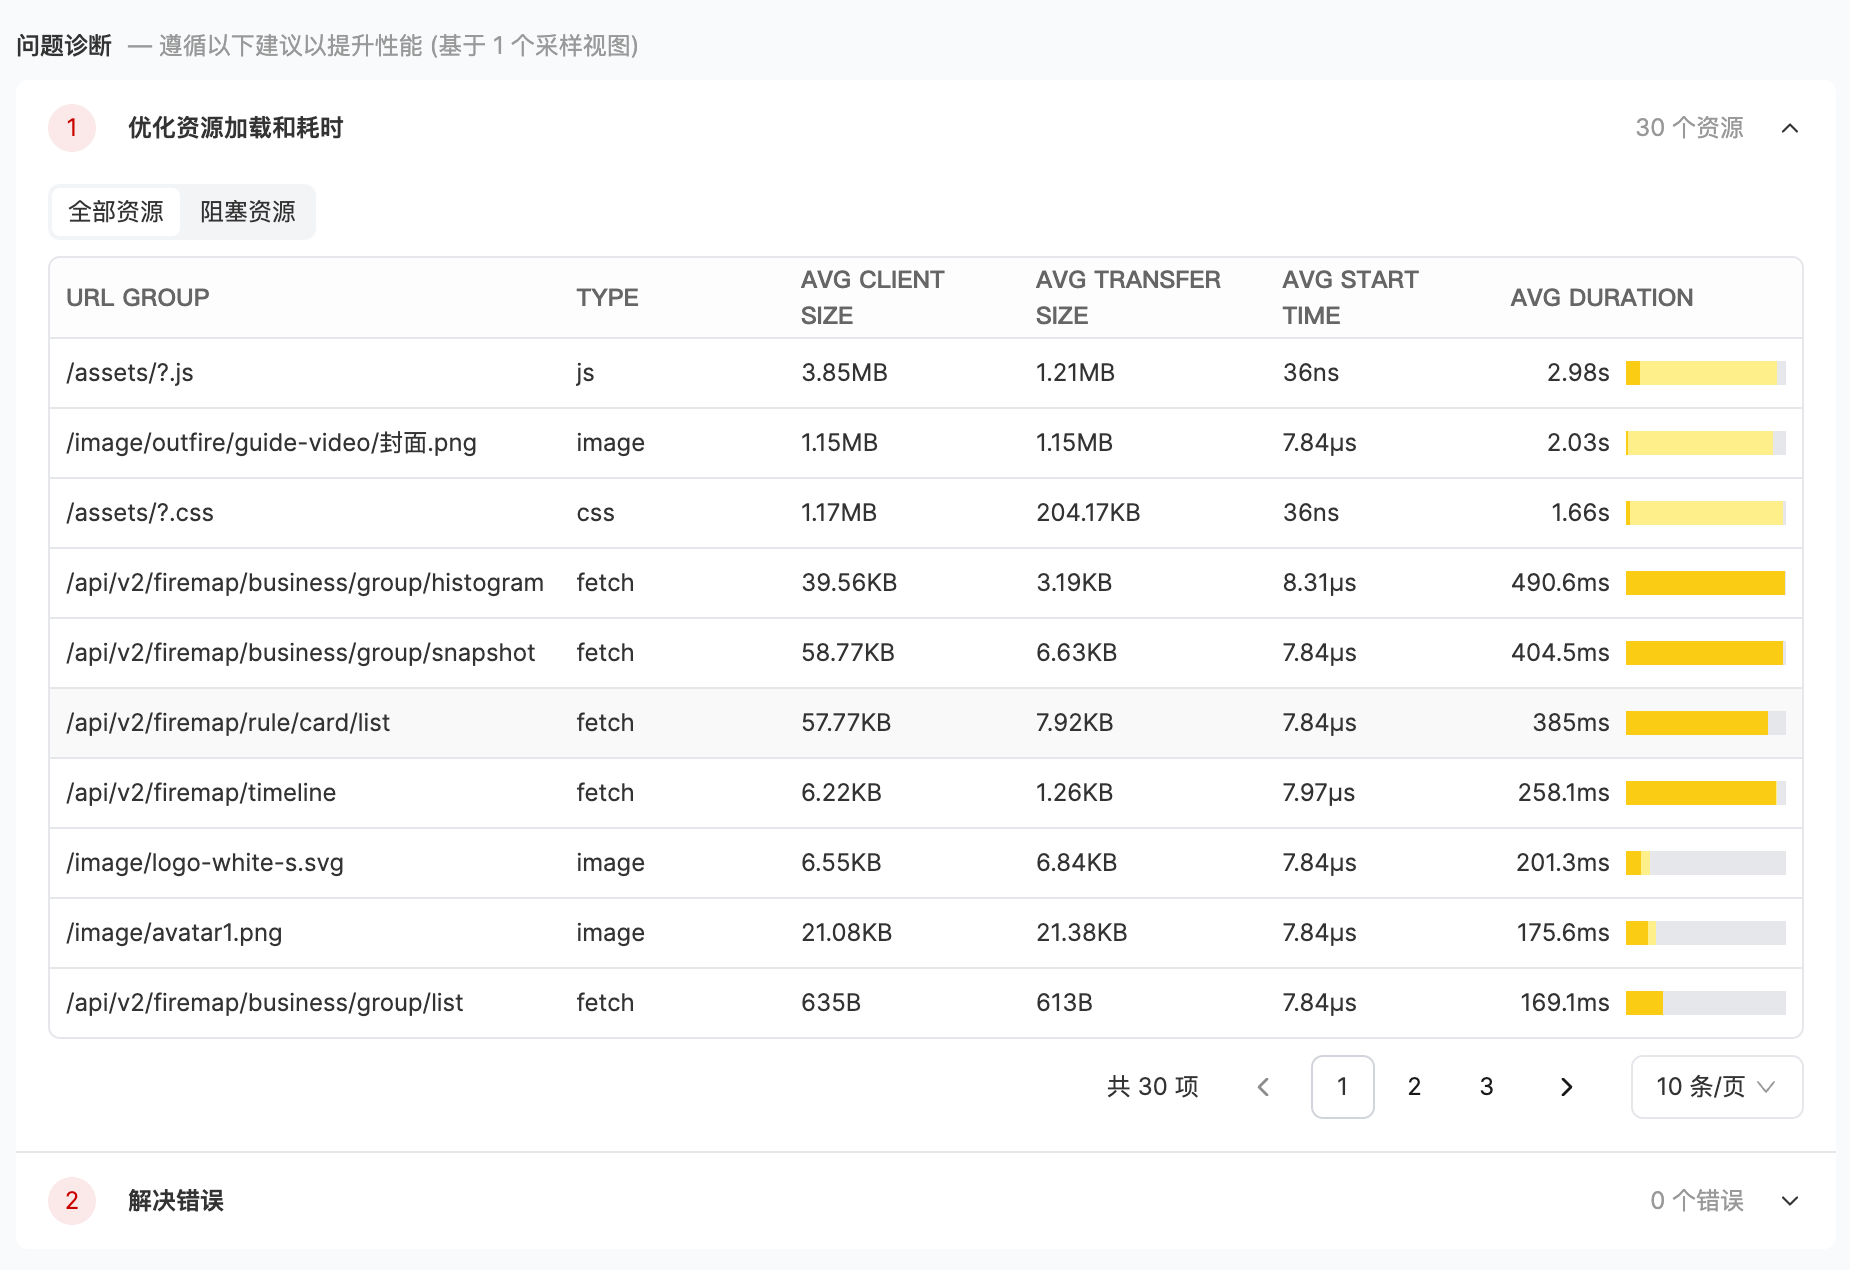
4
View Event Samples
If you cannot locate key information more accurately during the resource analysis phase, you can select appropriate event samples in the event samples section for more detailed contextual analysis.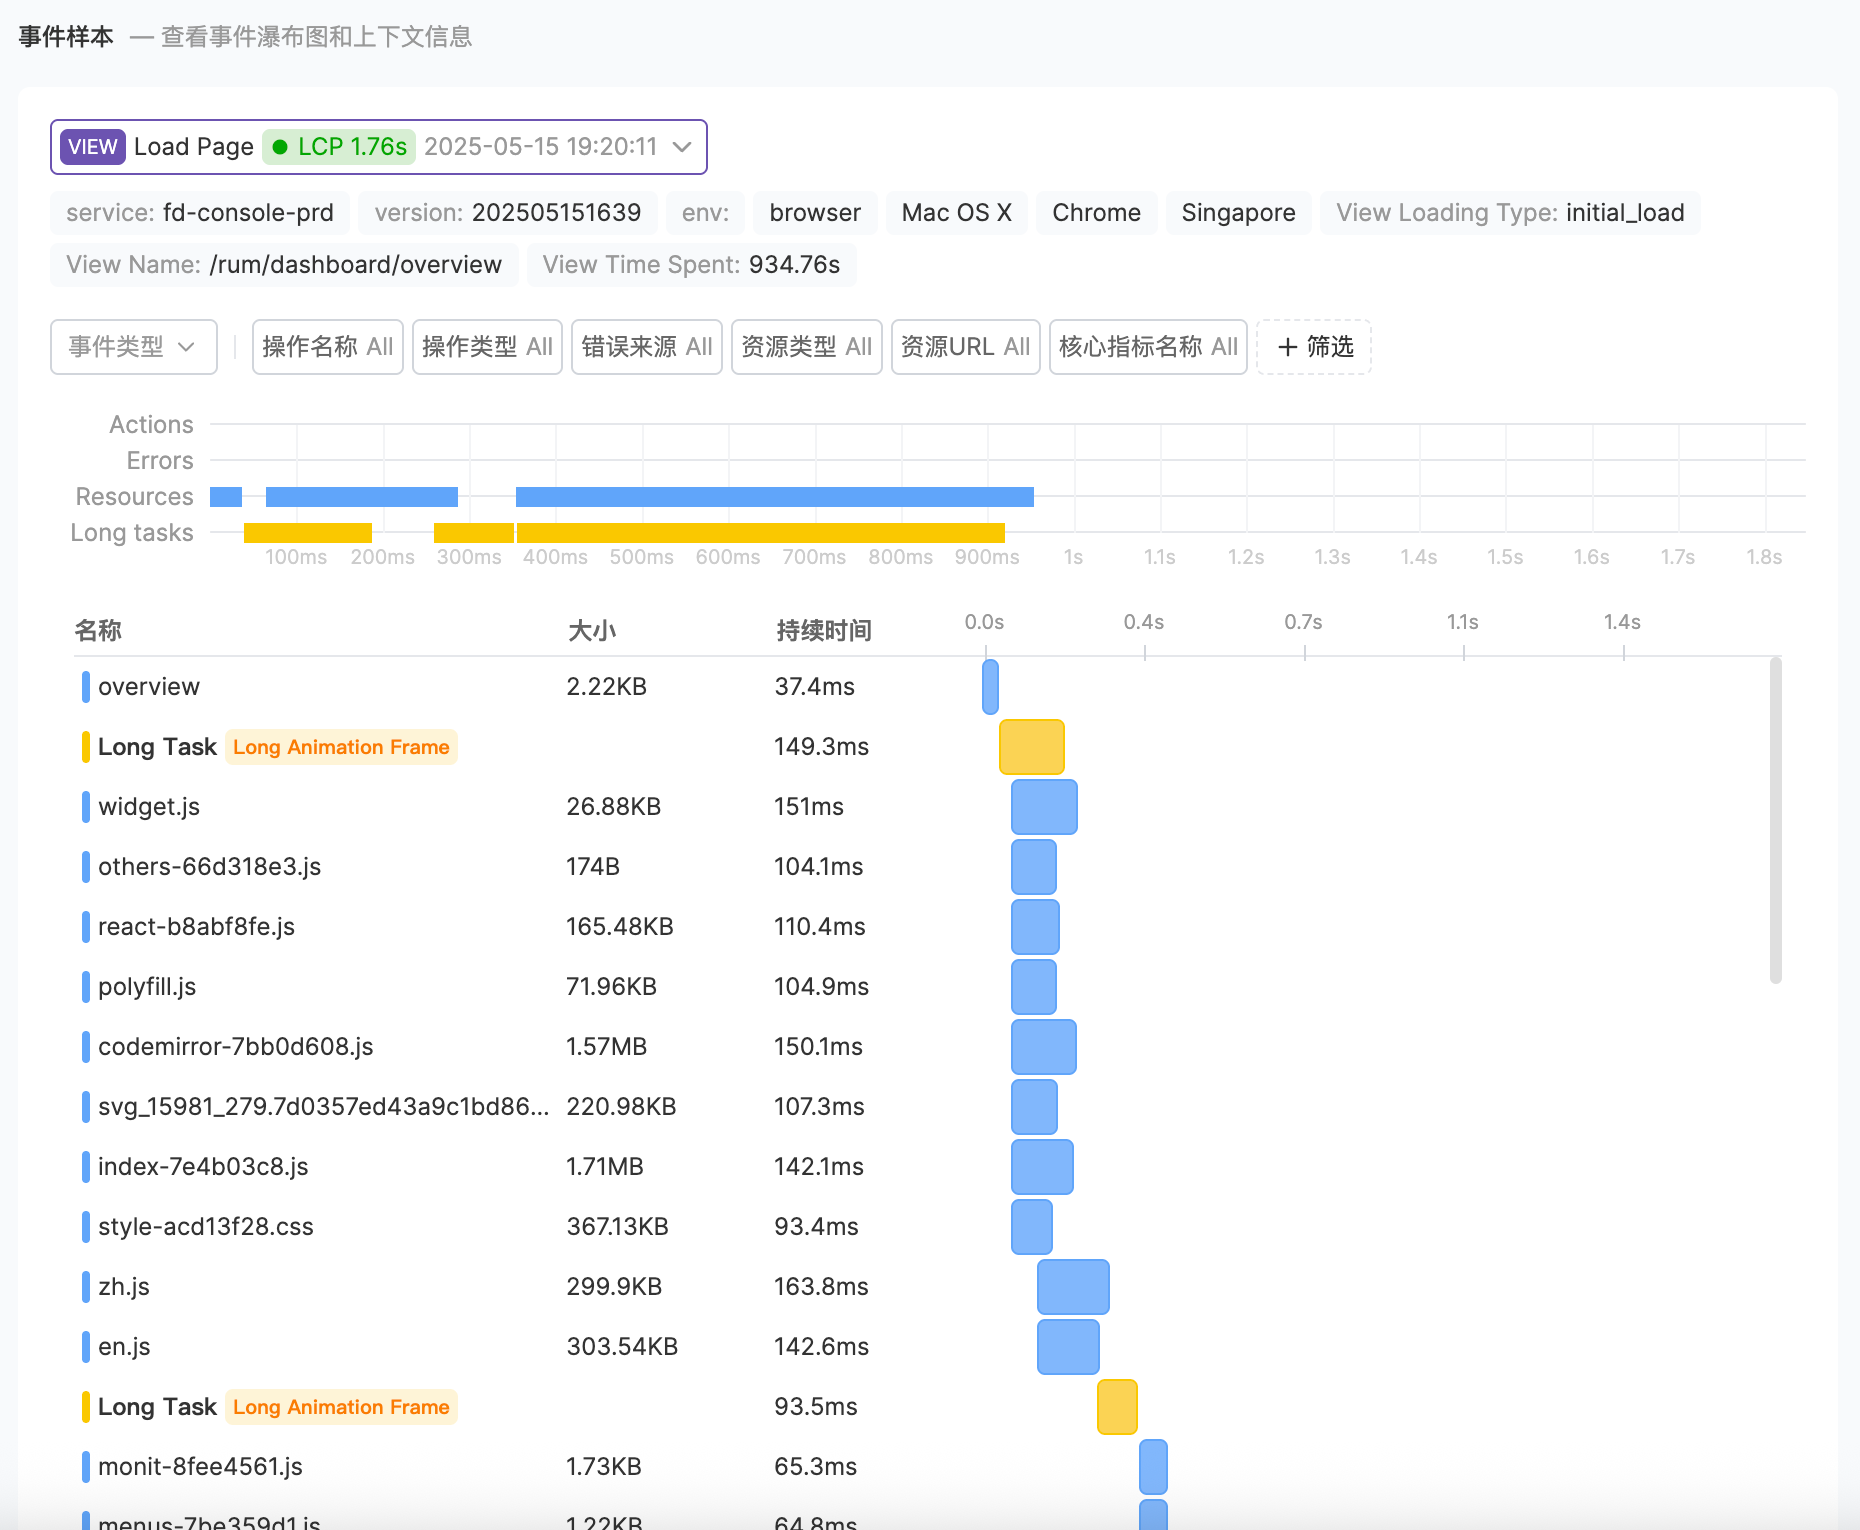
Optimization Directions
- Optimize Resource Loading
- Resolve Errors
- Waterfall Chart Analysis
The resource loading analysis panel displays detailed loading information for all resources under the current view, helping you identify performance bottlenecks.You can switch between two tabs to control the viewing scope:
- All Resources: Shows all resources loaded in the view
- Blocking Resources: Shows only resources marked as
blockingrender-blocking resources, which delay the page’s first render