

In Flashduty
You can get the integration push URL in either of the following ways.Use a dedicated integration
Choose this option if all alerts go to one channel. It’s the simpler setup.View dedicated integration setup steps
View dedicated integration setup steps
- In the Flashduty console, select Channel and open a channel
- Select Configuration → Integrations → Private integration, then click Add an integration
- Choose Azure Monitor integration and click Save to generate a card
- Open the generated integration card and copy the Push URL
Use a shared integration
Choose this option if you need to route alerts to different channels based on the alert payload.In Azure Monitor
Step 1: Configure webhook- Log in to your Azure Portal and select Monitor product;
- Go to
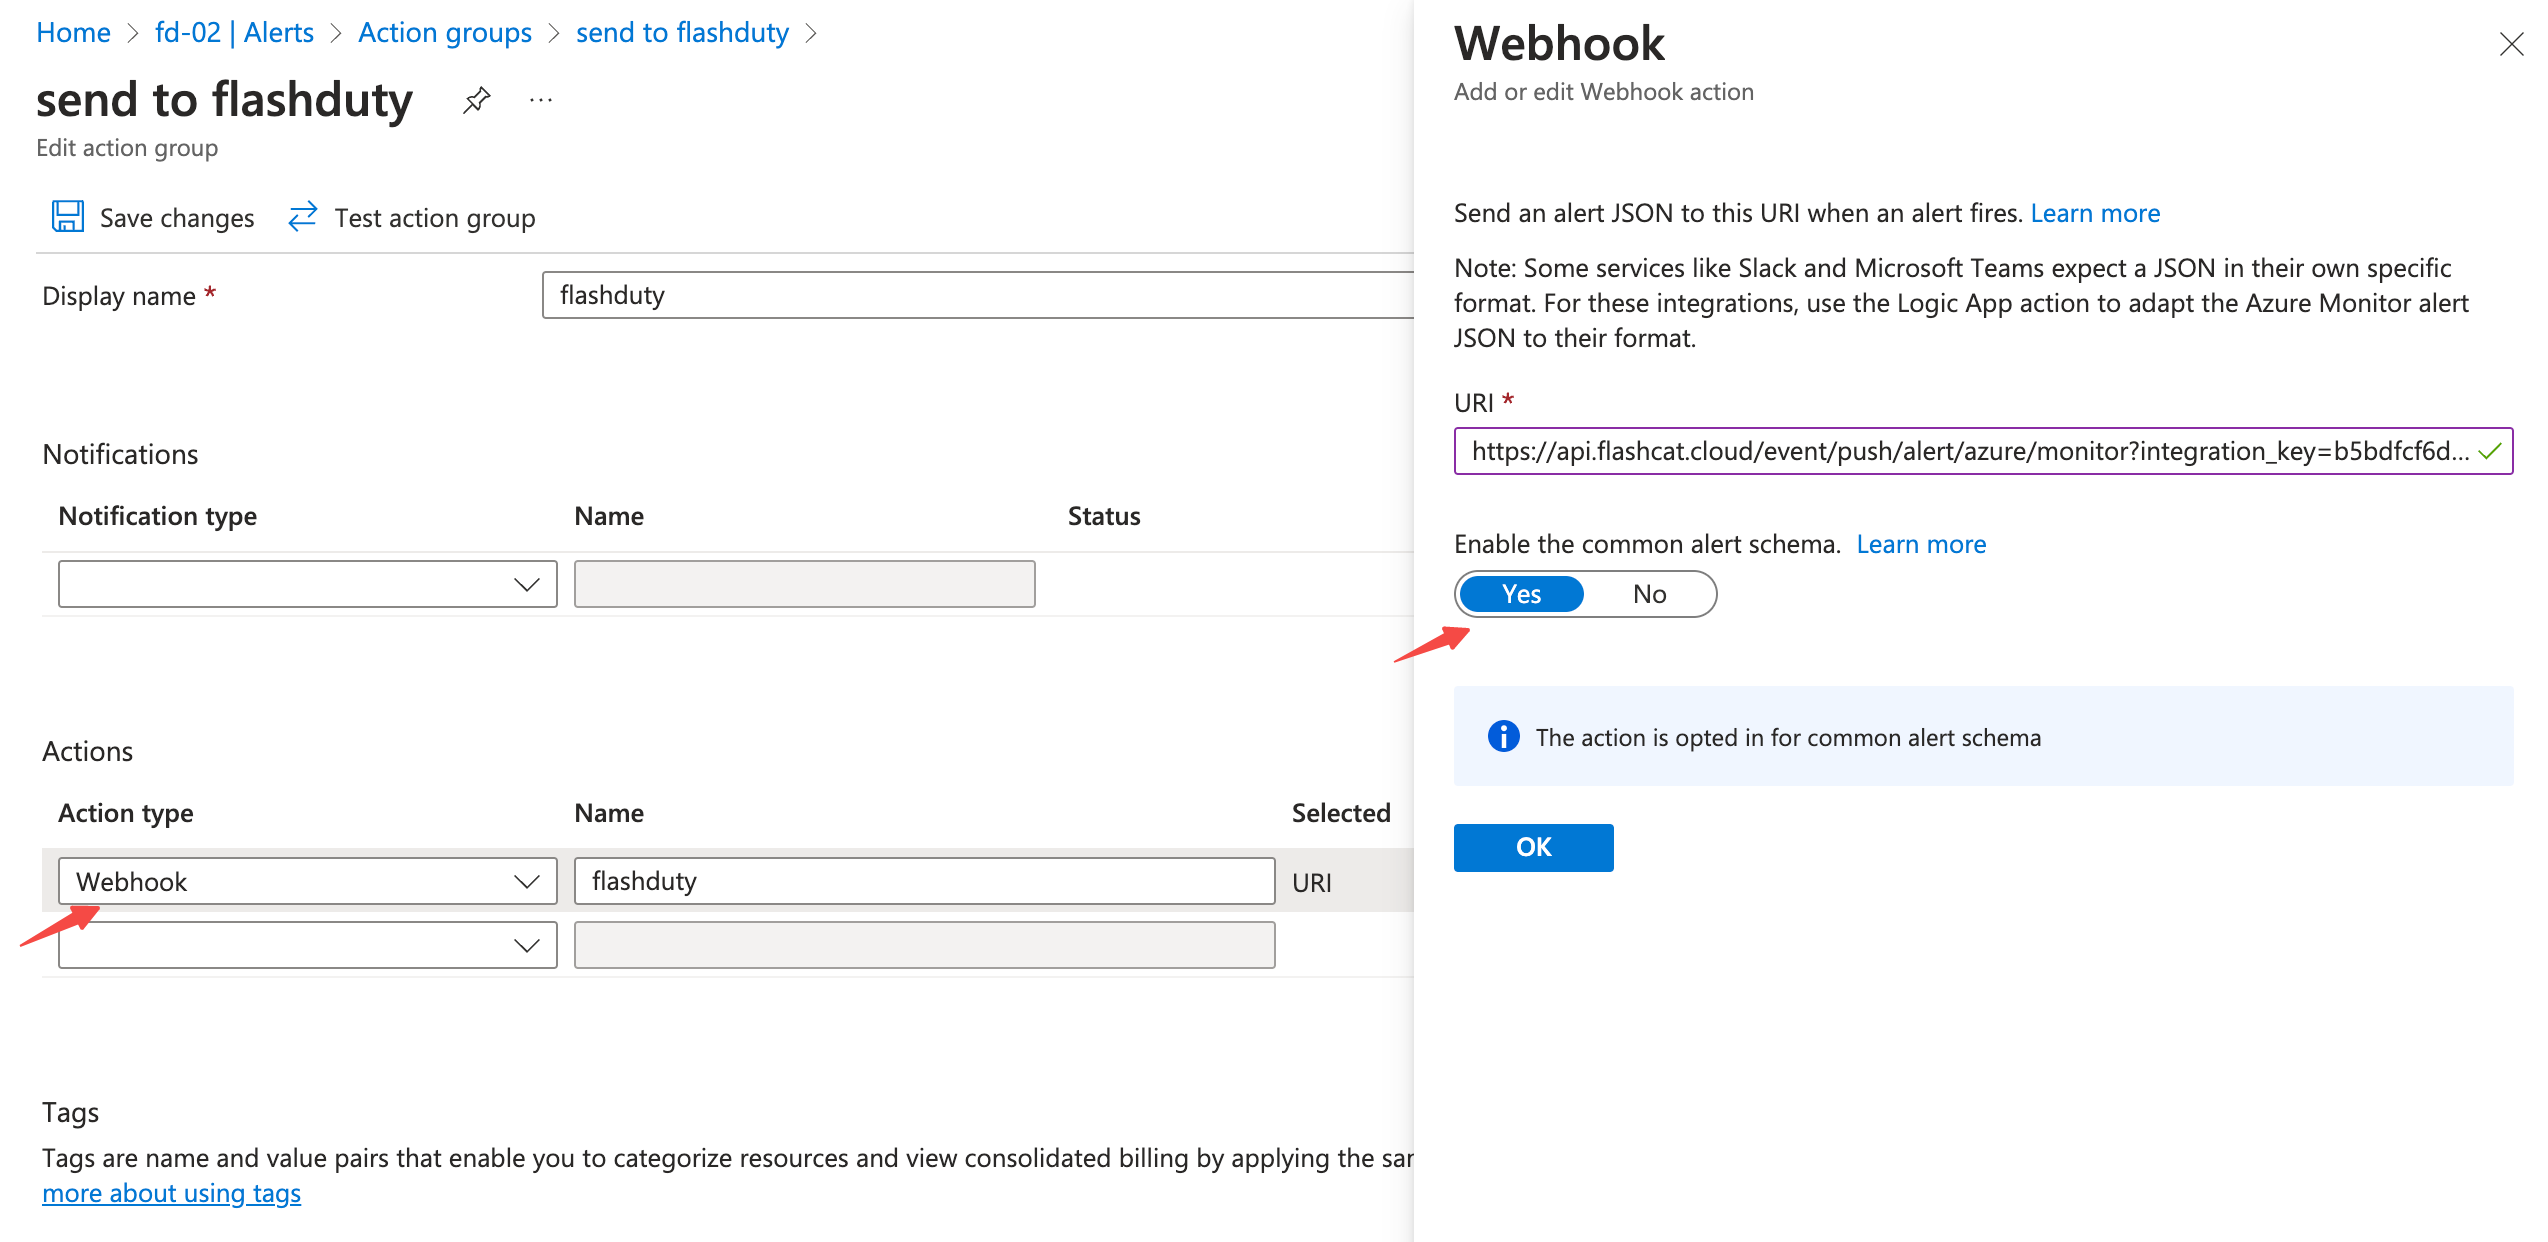
Alerts -> Action groupspage, and click Create; - Select
Action typeasWebhookunderActions; - Enter a name, copy and paste the integration push URL into the
URIfield. We recommend that youEnablethe common alert schema; - Click Create button to save.
 Flashduty also parses Azure’s noncommon payloads when the common alert schema is off: metric alerts, Log Alerts V1 log search alerts (Log Analytics and Application Insights), and activity log alerts. The only unsupported payload is a log search alert with a custom JSON payload. Such a request returns 400; enable the common alert schema instead.Step 2: Configure alert rule
-
Go to
Alerts -> Alert rulespage, click Create or select an existing policy to edit; -
Select the created Action group on the
Actionspage;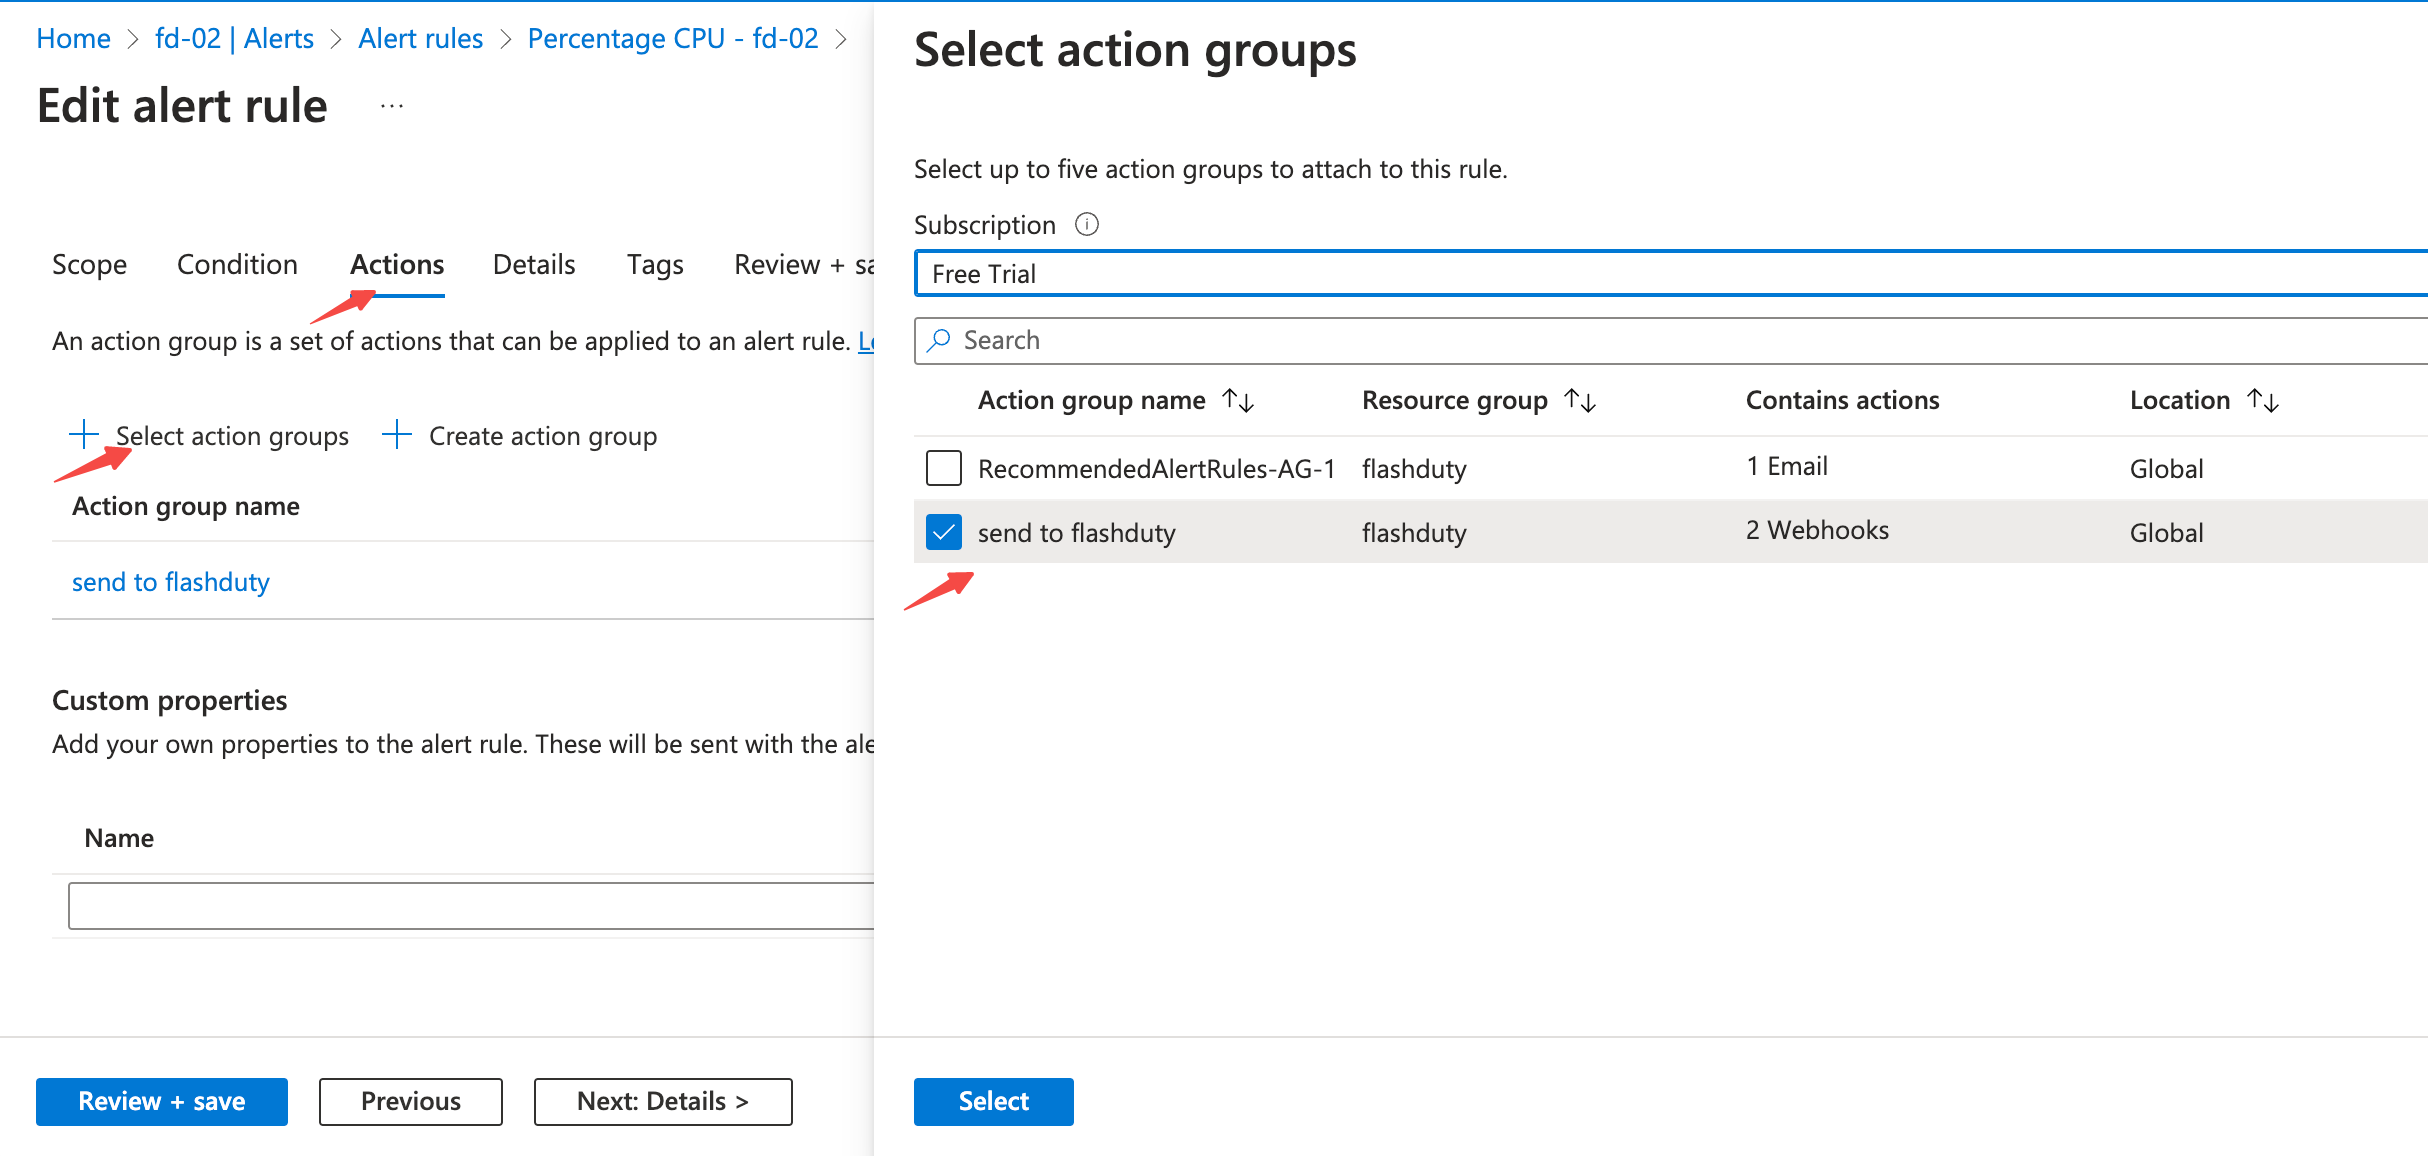
- Save and wait for alerts to trigger.
Service health
- In the Azure Portal, go to
Service Health -> Health alertsand clickCreate service health alert; - Select the subscription, services, regions, and event types (service issues, planned maintenance, health advisories, security advisories);
- Under
Actions, select the Action group created above and save.
stage) is Resolved, RCA, Complete, or Canceled. With the common alert schema, the alert title is “alert rule name on resource name” (only the rule name for subscription-level rules). Without it, the title is the event title and the description is Azure’s communication text. Labels include tracking_id, stage, incident_type, impacted_services, and impacted_regions, and service_health_url links to the event’s Service Health page.The Service Health sample sent by Test action group is at the Resolved stage, so Flashduty treats it as a recovery and does not create an alert.Resource health
- In the Azure Portal, go to
Service Health -> Resource healthand clickAdd resource health alert; - Select the resources to monitor. Under event status, select both
ActiveandResolved, otherwise Azure sends no recovery notification; - Under
Actions, select the Action group created above and save.
currentHealthStatus becomes Available or the activity log status is Resolved. Labels include current_health_status, previous_health_status, health_event_type, health_event_cause, and resource_id.Defender for Cloud security alerts
Defender for Cloud writes its security alerts to the
Security category of the activity log. In Alerts -> Alert rules, create an alert rule whose condition is an activity log signal with category Security, and select the Action group created above.With the common alert schema, the alert title is “alert rule name on resource name” and the severity is Info (Azure sends every activity log alert as Sev4). The security alert’s own severity, category, and affected entity are added as the vendor_severity, category, and compromised_entity labels, which you can use in routing or noise reduction rules. Without the common alert schema, the title is the security alert’s description or category plus the affected entity, for example Failed SSH brute force attack on LinuxVM1, and the severity follows the security alert: High maps to Critical, Medium to Warning, and Low and Informational to Info. Each security alert notification creates its own Flashduty alert, which does not recover automatically; close it by hand once handled.Other activity log alerts
Administrative, Policy, Autoscale, and Recommendation activity log alerts are one-shot events: each notification creates one Flashduty alert that does not recover automatically. With the common alert schema, the alert title is “alert rule name on resource name” and the operation goes into the
operation_name label. Without it, the payload has no rule name, so the title is “operation on resource”, for example Microsoft.Compute/virtualMachines/restart/action on test-VM.Alert key and recovery
Dimensions of metric and log alerts (for example
ApiName or Computer), the metric name metric_name, the query search_query, and the labels of Prometheus alerts all become Flashduty labels. subscription_id, resource_group, and resource_id are parsed from the resource ID.Status mapping
Azure Monitor to Flashduty alert severity mapping:
Noncommon metric alerts and Log Alerts V1 express severity as
0 to 4, mapped as above. The Critical, Warning, and Informational values of the legacy Log Analytics alert API map to Critical, Warning, and Info. Azure sends every activity log alert as Sev4 (Info); security alerts sent without the common alert schema follow the security alert severity mapping above.FAQ
- Azure reports a failed webhook call (400): check whether the log search alert uses a custom JSON payload. Enable the common alert schema and retry.
- A Service Health alert does not recover: Azure sends a
Resolvedstage notification when the event is resolved; make sure the alert rule is still enabled. Planned maintenance recovers at theCompleteorCanceledstage. - A Resource Health alert does not recover: make sure the alert rule’s event status includes
Resolved. - An alert appears after testing the Action group: except for Service Health, Azure’s test samples cannot be told apart from real alerts, so they create alerts. Close them by hand.
- A Service Health or Resource Health notification has no Tracking ID or resource ID: with the common alert schema, each such notification becomes its own alert and does not recover automatically.