

在 Flashduty On-call
您可通过以下两种方式获取集成推送地址,任选其一即可。使用专属集成
如果您只需将告警发往一个协作空间,选择此方式,配置更简单。查看专属集成的配置步骤
查看专属集成的配置步骤
- 进入 Flashduty 控制台,选择 协作空间,打开一个协作空间
- 选择 配置 → 集成数据 → 专属集成,点击 新增一个集成
- 选择 Azure Monitor 集成,点击 保存,生成卡片。
- 打开生成的集成卡片,复制 推送地址
使用共享集成
如果您需要根据告警事件的 Payload 将告警路由到不同协作空间,选择此方式。查看共享集成的配置步骤
查看共享集成的配置步骤
- 进入 Flashduty 控制台,选择 集成中心 → 告警事件
- 选择 Azure Monitor 集成:
- 集成名称:为当前集成定义一个名称。
- 配置默认路由并选择协作空间;创建后可在 路由 中增加更多规则
- 点击 保存,复制生成的 推送地址
在 Azure Monitor
步骤 1:配置 Webhook- 登录您的 Azure 门户,选择 Monitor 产品
- 进入
Alerts -> Action groups页面,单击 Create 按钮,开始编辑 - 如图,
Actions选项选择Action type为Webhook - 填写名称,
URI部分复制写入集成的推送地址,建议Enable通用告警架构(common alert schema) - 点击 Create 按钮,提交保存。
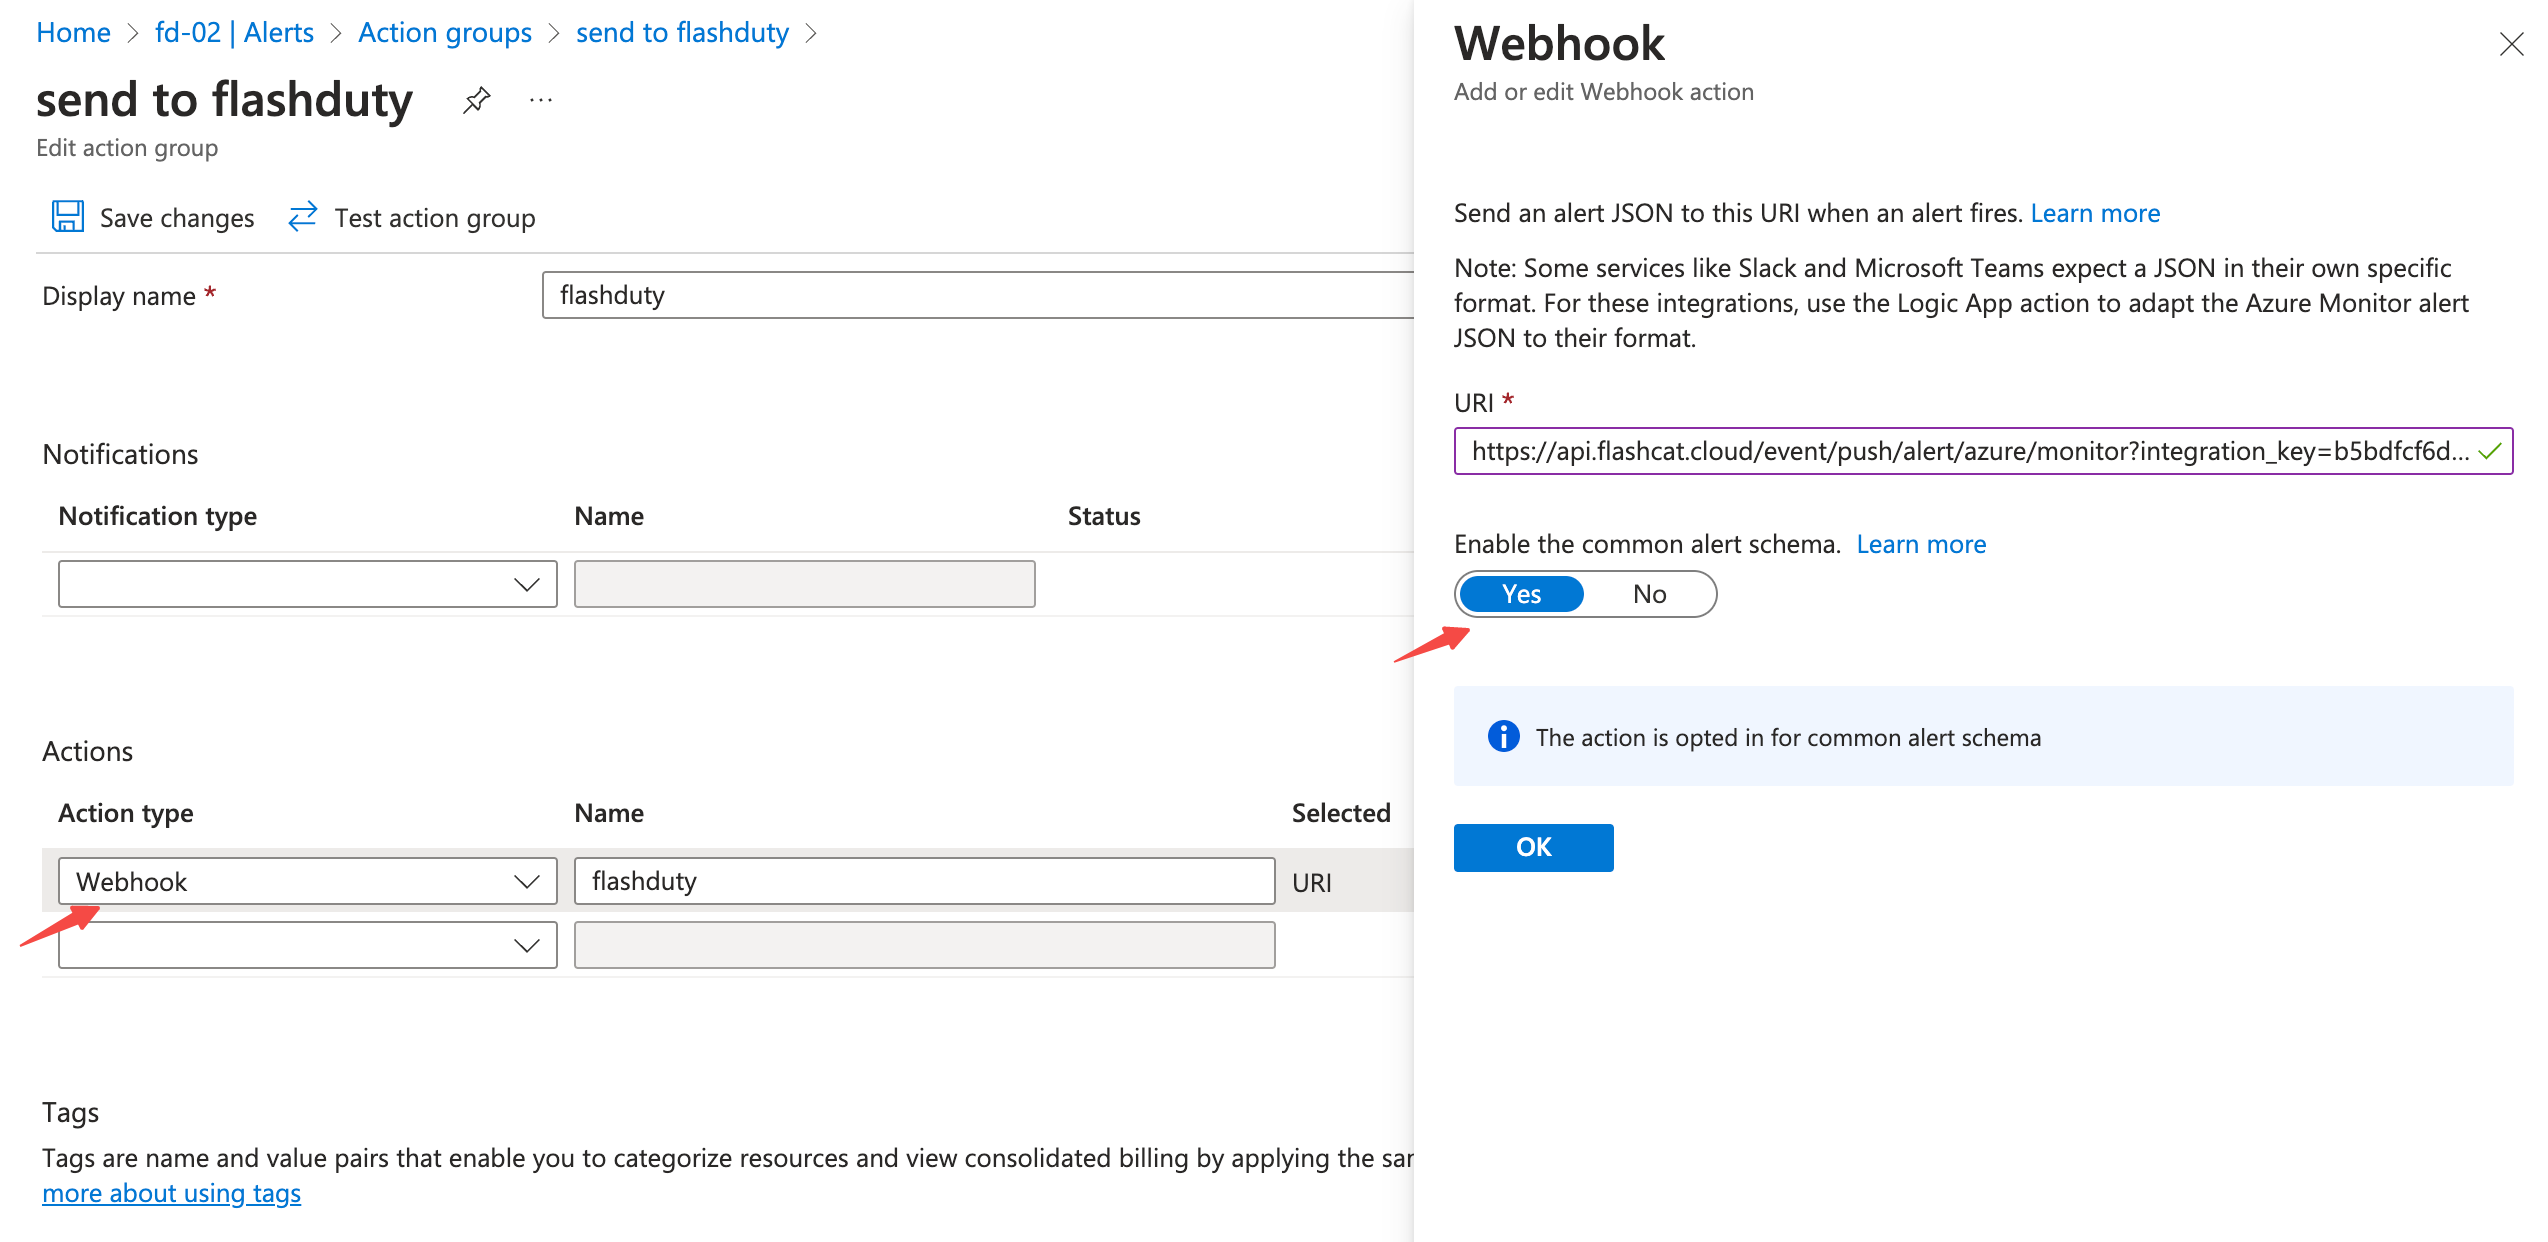 未开启通用告警架构时,Flashduty 也能解析 Azure 的旧版(noncommon)Payload:指标告警、Log Alerts V1 日志搜索告警(Log Analytics 与 Application Insights)和活动日志告警。唯一不支持的是日志搜索告警的“自定义 JSON Payload”,这种请求会返回 400,请改用通用告警架构。步骤 2:配置 Alert rule
-
进入
Alerts -> Alert rules页面,单击 Create 或 选择已有的策略进行编辑 -
如下图所示,在
Actions页面,选择已创建好的 Action group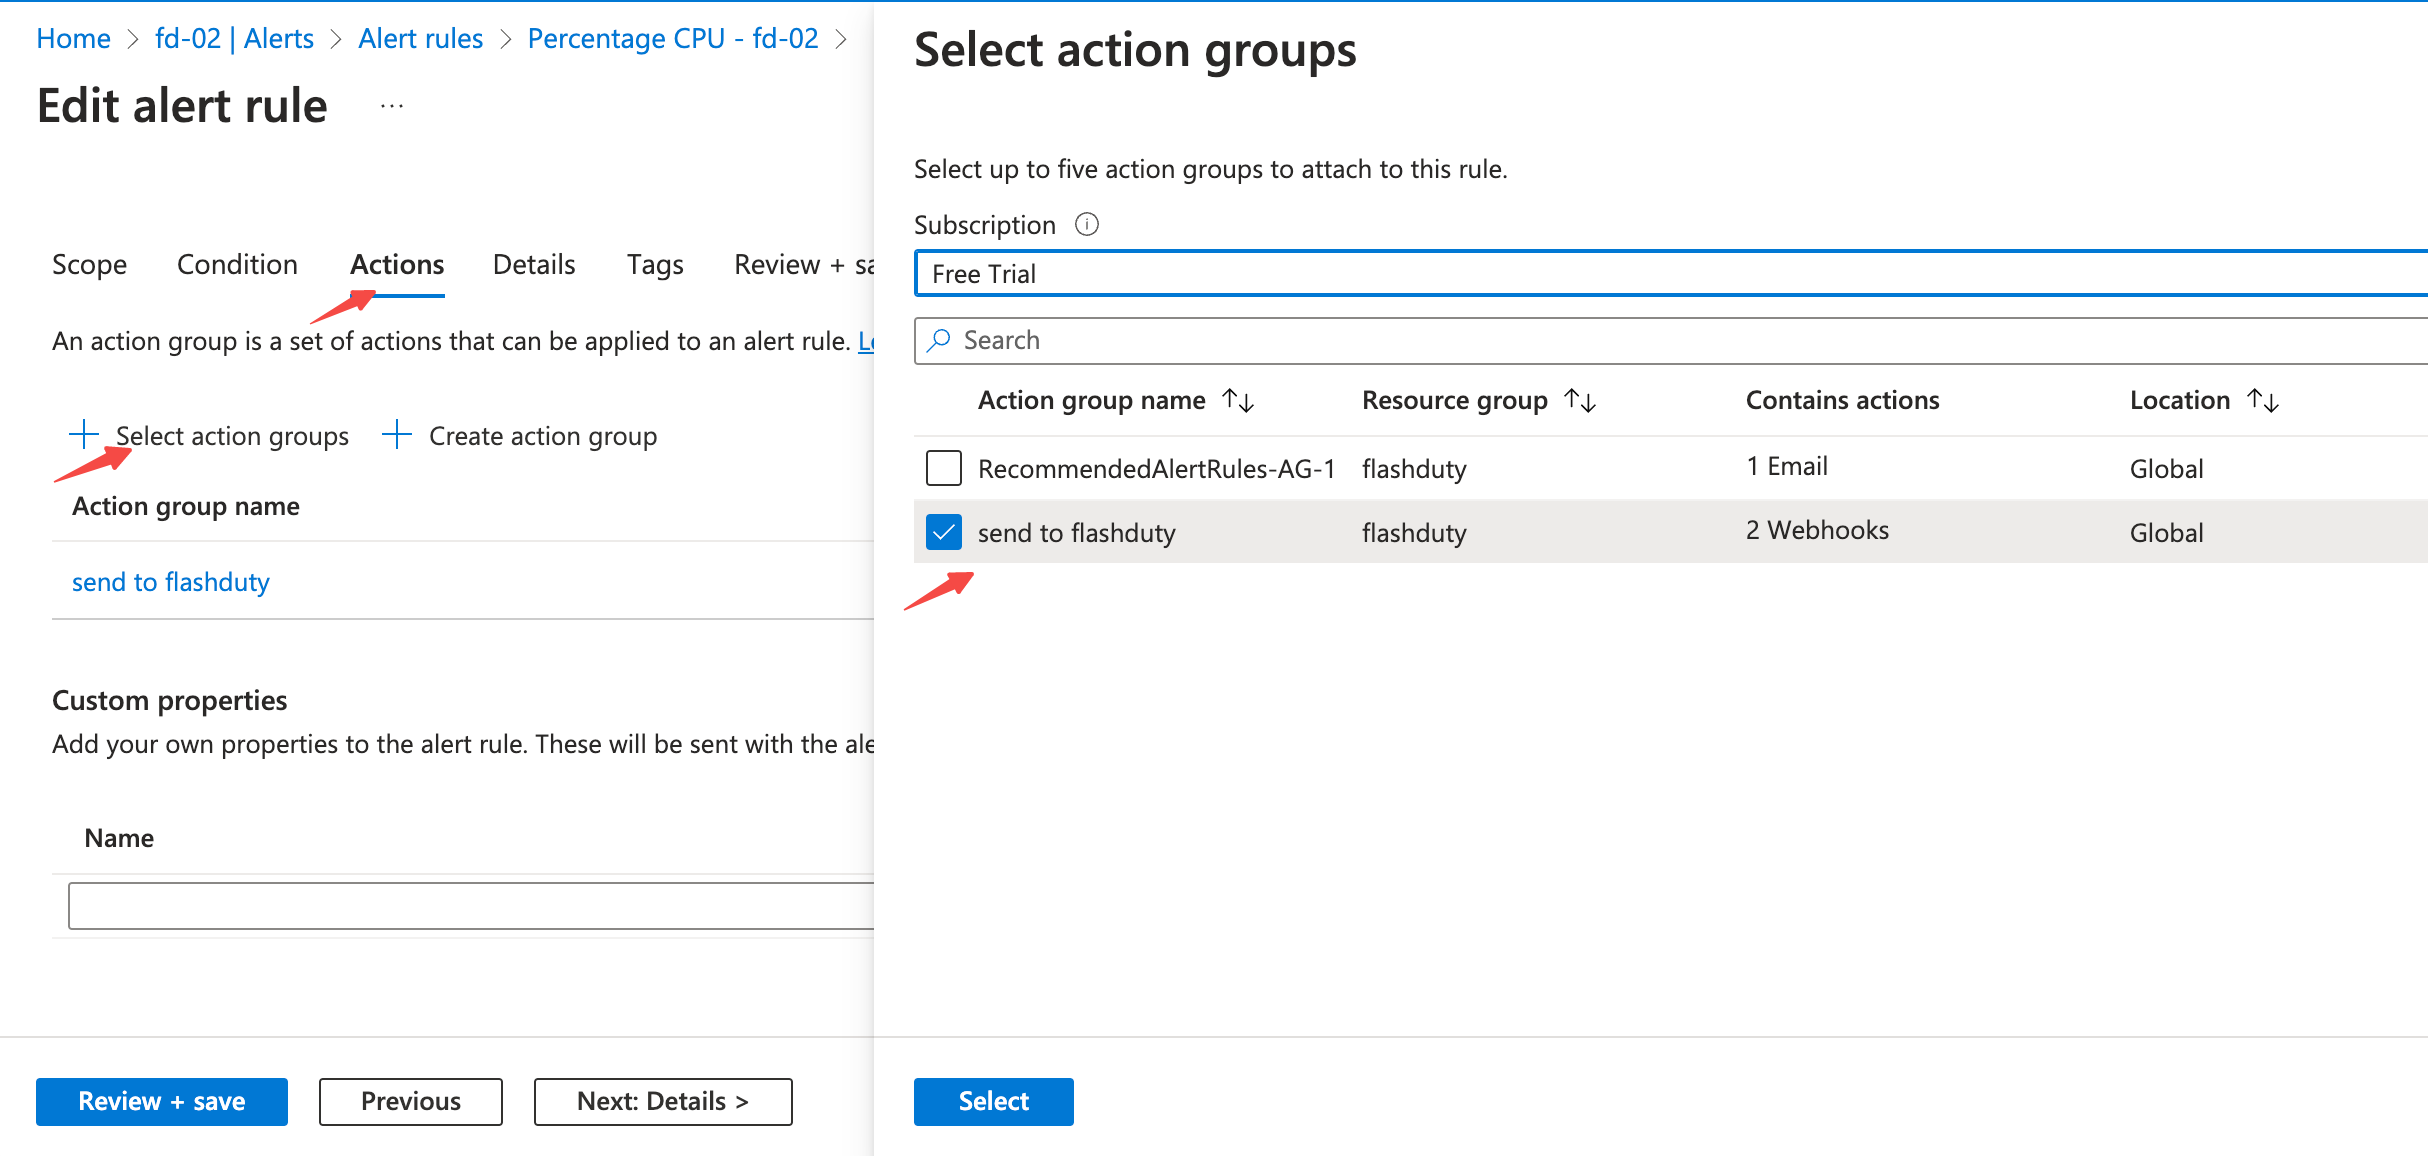
- 提交保存,等待告警触发。
服务运行状况(Service Health)
- 在 Azure 门户进入
Service Health -> Health alerts,点击Create service health alert - 选择订阅、服务、区域和事件类型(服务问题、计划内维护、运行状况公告、安全公告)
- 在
Actions中选择上面创建的 Action group,保存。
stage)为 Resolved、RCA、Complete 或 Canceled 时告警自动恢复。开启通用告警架构时,告警标题为“告警规则名称 on 资源名”(订阅级规则只有规则名称);未开启时,标题取自事件标题,描述为 Azure 的通报正文。标签包含 tracking_id、stage、incident_type、impacted_services、impacted_regions,service_health_url 指向该事件的 Service Health 页面。Action group 的 Test action group 发送的 Service Health 示例处于 Resolved 阶段,Flashduty 按恢复处理,不会新建告警。资源运行状况(Resource Health)
- 在 Azure 门户进入
Service Health -> Resource health,点击Add resource health alert - 选择要监控的资源;在事件状态中勾选
Active与Resolved,否则 Azure 不会发送恢复通知 - 在
Actions中选择上面创建的 Action group,保存。
currentHealthStatus)变为 Available,或活动日志状态为 Resolved 时告警恢复。标签包含 current_health_status、previous_health_status、health_event_type、health_event_cause 和 resource_id。Defender for Cloud 安全告警
Defender for Cloud 的安全告警会写入活动日志的
Security 类别。在 Alerts -> Alert rules 新建告警规则,条件选择活动日志信号,类别(Category)为 Security,Action 选择上面创建的 Action group。开启通用告警架构时,告警标题为“告警规则名称 on 资源名”,等级为 Info(Azure 对活动日志告警统一使用 Sev4),安全告警自身的严重性、类别和受影响实体写入 vendor_severity、category、compromised_entity 标签,可据此配置路由或降噪规则。未开启通用告警架构时,告警标题取自安全告警的描述或类别加上受影响的实体,例如 Failed SSH brute force attack on LinuxVM1,等级按安全告警严重性映射:High 为 Critical,Medium 为 Warning,Low 与 Informational 为 Info。每条安全告警通知对应一个 Flashduty 告警,不会自动恢复,处理完成后请手动关闭。其他活动日志告警
管理操作(Administrative)、策略(Policy)、自动缩放(Autoscale)和顾问建议(Recommendation)的活动日志告警是一次性事件:每条通知对应一个 Flashduty 告警,不会自动恢复。开启通用告警架构时,告警标题为“告警规则名称 on 资源名”,操作名写入
operation_name 标签;未开启时,Payload 不含规则名称,标题为“操作名 on 资源名”,例如 Microsoft.Compute/virtualMachines/restart/action on test-VM。Alert Key 与恢复
指标与日志告警的维度(例如
ApiName、Computer)、指标名 metric_name、查询语句 search_query,以及 Prometheus 告警的标签都会写入 Flashduty 标签;subscription_id、resource_group、resource_id 从资源 ID 中解析。状态对照
Azure Monitor 到 Flashduty 告警等级映射关系:
旧版架构的指标告警和 Log Alerts V1 使用
0 到 4 表示严重性,按上表对应;旧版 Log Analytics 告警 API 的 Critical、Warning、Informational 分别对应 Critical、Warning、Info。活动日志告警在 Azure 中统一为 Sev4(Info);未开启通用告警架构的安全告警例外,按上文的安全告警严重性映射。常见问题
- Azure 显示 Webhook 调用失败(400):检查日志搜索告警是否配置了自定义 JSON Payload,改为开启通用告警架构后重试。
- 服务运行状况告警没有恢复:Azure 在事件解决后发送
Resolved阶段通知,请确认告警规则仍然启用;计划内维护在Complete或Canceled阶段恢复。 - 资源运行状况告警没有恢复:确认告警规则的事件状态包含
Resolved。 - 测试 Action group 后看到了告警:除服务运行状况外,Azure 的测试示例与真实告警无法区分,会创建告警,请手动关闭。
- 服务运行状况或资源运行状况通知缺少 Tracking ID 或资源 ID:开启通用告警架构时,这类通知每条单独成为一个告警,不会自动恢复。